On this page
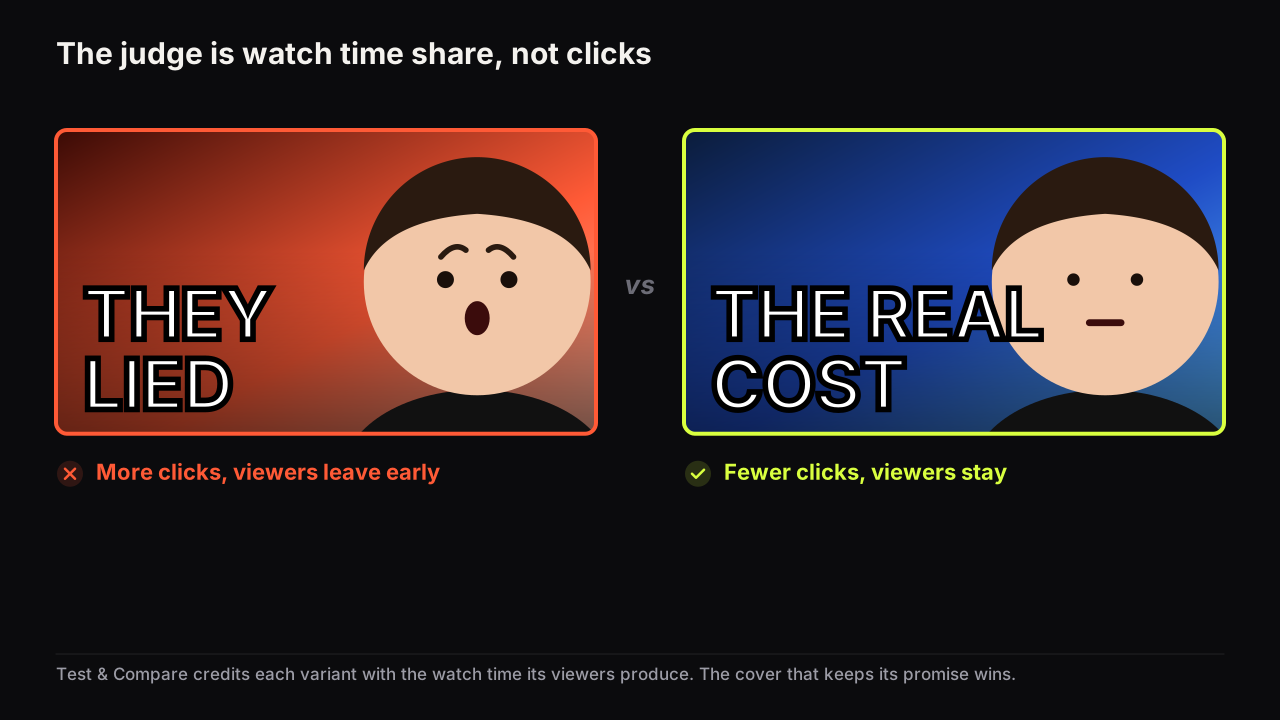
The cover with more clicks lost. If you have stared at a Test & Compare result thinking that, nothing was broken. Test & Compare in YouTube Studio decides a thumbnail test by watch time share: the proportion of the video's total watch time during the test that each variant accounted for. YouTube's help page on testing titles and thumbnails states that the result is decided by watch time share, not clicks. A cover that pulls in more viewers loses if those viewers leave early. Once that sinks in, about half the variants you were planning to test stop being worth the upload.
What watch time share is
Watch time share is each variant's slice of the total watch time the video earned from test viewers. Every viewer in the test sees one variant, whatever they go on to watch is credited to it, and at the end each total is expressed as a share of the whole.
The arithmetic is plain. Suppose viewers who saw thumbnail A watched 30 hours of the video during the test and viewers who saw thumbnail B watched 70. The total is 100 hours; A's share is 30% and B's is 70%. Clicks appear nowhere in the calculation. They are the doorway the watch time came through.
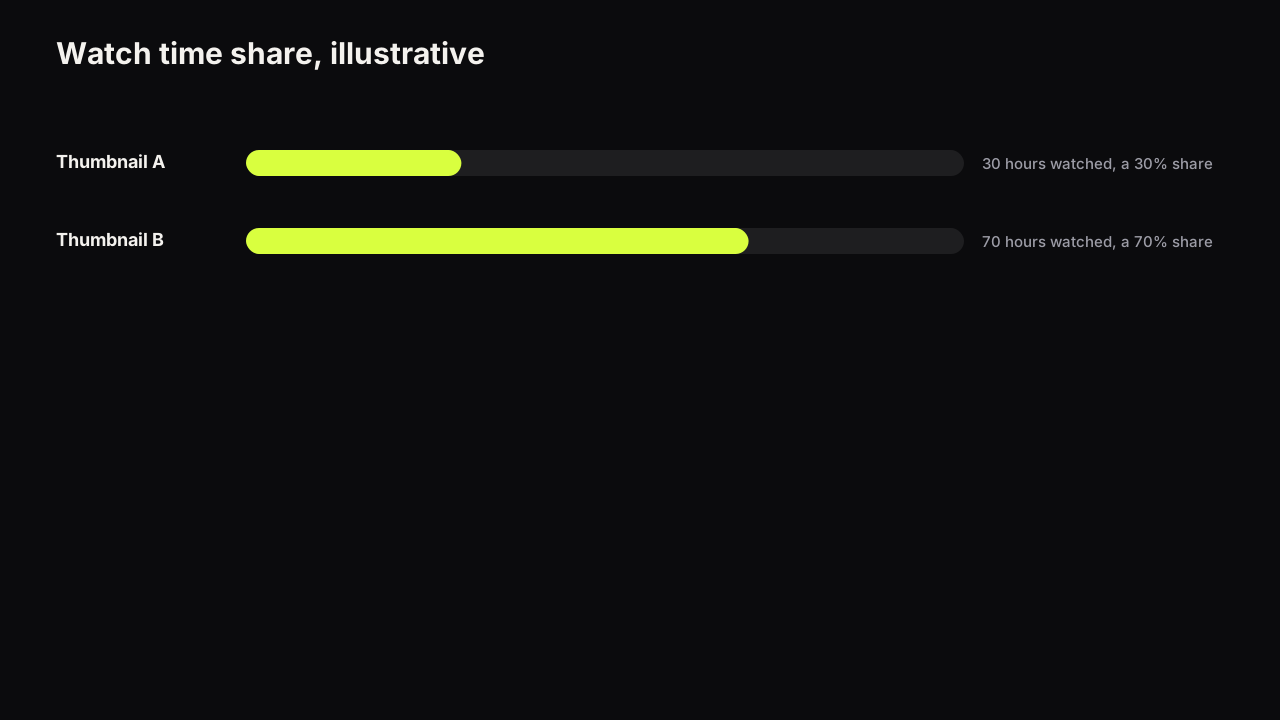
The hours above are invented to show the arithmetic. YouTube does not publish the underlying watch time for each variant in a form we can cite, and the help page describes the outcome in terms of share and confidence rather than raw hours.
A variant's share is fed by two things: how many viewers it brought in, and how long each of them stayed. A cover can win the first and lose the second. That is what makes the metric a better judge of packaging than either number on its own. It rewards the cover whose promise the video keeps.
Why YouTube judges by watch time rather than clicks
YouTube has not given us a quotable sentence explaining the choice, so this is our reading, and it is also the judge we would pick for ourselves. A test scored by clicks rewards whichever cover makes the boldest promise, kept or not. Creators learn to escalate, viewers learn to distrust covers, and the platform ends up training its own audience to click less. Scoring by watch time share makes the test agree with what the viewer wanted: a video worth their time. We would judge our own manual swaps the same way, even though watch time is slower and messier to read out of Analytics than a CTR line, because a click-judged test teaches you to make covers the video cannot live up to.
The policy side of that is documented. YouTube's thumbnails policy says thumbnails that violate the Community Guidelines are removed and can earn a strike, and it points to the spam, deceptive practices and scams policy for titles, thumbnails and descriptions that promise content the video does not contain. The testing tool and the policy pull in the same direction. A cover that opens a question is fine; a cover that lies loses twice.
It is also the mechanism behind the curiosity gap done properly. Opening the gap earns the click, the video closing it earns the watch time, and a test judged by share measures the whole loop.
Why a higher-CTR thumbnail can lose
A second example, invented numbers again, makes the failure mode concrete.
| Thumbnail A (provocative) | Thumbnail B (accurate) | |
|---|---|---|
| Viewers it brought in | 1,200 | 900 |
| Average time each stayed | 2 minutes | 4 minutes |
| Total watch time | 40 hours | 60 hours |
| Watch time share | 40% | 60% |
Thumbnail A brought in a third more viewers. Read as CTR in Analytics, A is the obvious winner. But A's viewers stayed half as long, and B ends up with the larger share of the total. The tool reports B as the better thumbnail, and it is right: B found the viewers who wanted this video.
Most of the covers we see win on CTR and lose on share promise a different video from the one behind them: a bigger reaction than the footage contains, a number the video never explains, an expression the content does not justify. The tool is not being contrary. It is measuring the gap between the packaging and the video.
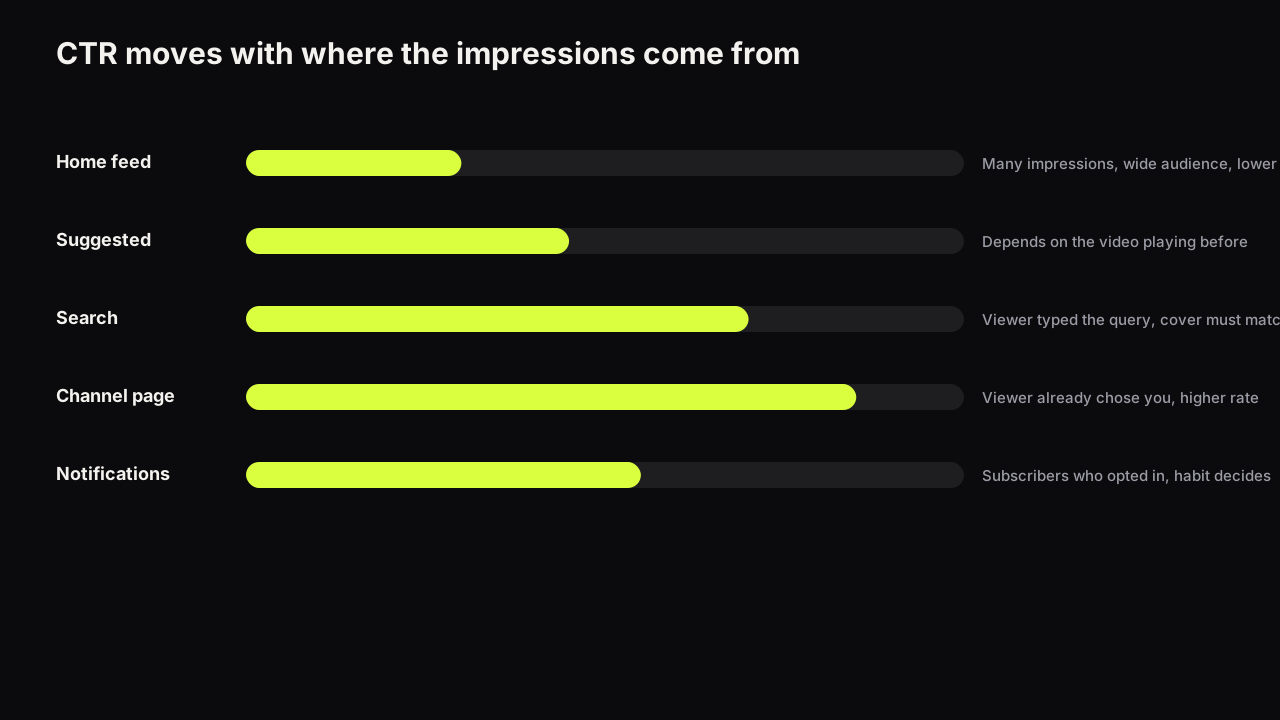
The reverse also happens. A quieter cover that brings in fewer but better-matched viewers can win a test while showing a lower CTR than the channel's average. Before calling that a problem, remember that CTR depends heavily on where the impressions come from, and a test's viewers are spread across surfaces in a way the blended line does not show.
I don't have a personal test I'd cite here, but I think this is the most important lesson in thumbnail testing. The highest-CTR thumbnail is not necessarily the best thumbnail. If one version gets slightly fewer clicks and those viewers watch significantly more of the video, it is attracting a better-qualified viewer. Optimising purely for clicks pushes creators toward clickbait. The objective is the right person clicking with the right expectation.
What each result state means and what to do next
YouTube reports the outcome in one of four states. The middle column uses the help page's wording; the actions are ours.
| Result state | YouTube's description | What to do |
|---|---|---|
| Winner | "clearly outperformed the others based on watch time share... statistically significant" | Adopt it. Log the lever you changed and which direction won. |
| Preferred | Thumbnail-only tests: likely outperformed but not confidently | Treat it as a lean. Test the same lever again on the next comparable video. |
| Performed the same | No meaningful difference in watch time share | The lever you changed does not matter to this audience for this kind of video. That is worth knowing; stop testing it. |
| Inconclusive | Not enough separation; the first uploaded option becomes the default | Variants too similar or impressions too few. Re-test with a larger difference, or accept the default and move on. |
Two practical details fall out. Inconclusive hands the default to the first uploaded option, so upload the cover you would be content to keep first. And Preferred only appears on thumbnail-only tests, so a title-and-thumbnail combination test gives you a confident Winner or one of the two flat outcomes, never the lean.
Take an invented case of the flat outcome. A twenty-minute woodworking tutorial, two covers that differ only in the headline (DAY 1 against £40 BENCH), and Performed the same after ten days. The temptation is a third headline. We would not. The audience has said the number does not move them for this kind of video, so the next test changes a different lever entirely, probably the object: the finished bench large against the tools laid out. A flat result is a lesson if you changed one thing. If you changed three, it is noise.
We would test thumbnails alone by default and titles in a separate test later, even though that is slower than a combined test, because Preferred exists only for thumbnail-only tests and a channel with modest impressions will see far more leans than confident winners. Two leans in the same direction on two videos are worth more than one flat combined result. When combining is worth the wait is the subject of testing titles and thumbnails together.
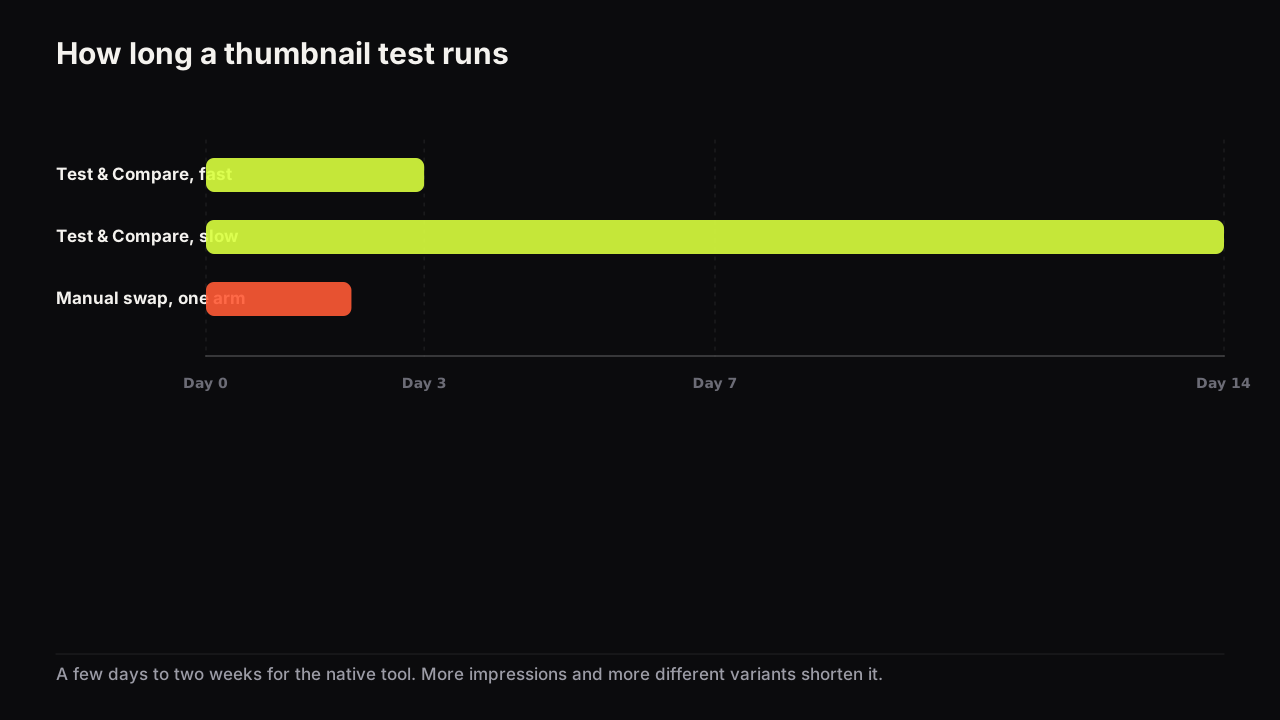
If a test sits unresolved longer than you expected, the two things that speed it up are more impressions and more different variants. How long a thumbnail test should run covers what to do while you wait and when to give up.
What this changes about how you design variants
Once the judge is watch time share, a few habits follow.
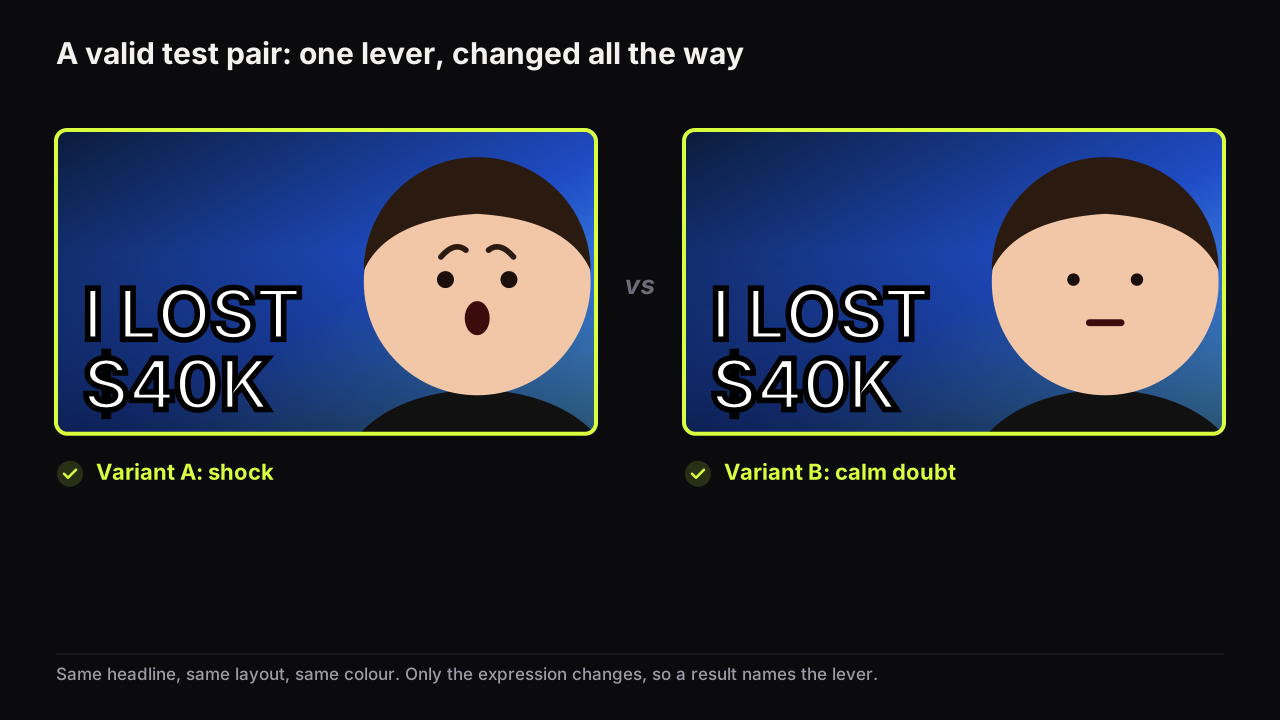
Test different promises, not different bait. Two variants that both overpromise will both bleed watch time; the test picks the less bad one and you learn nothing. Test a shock face against a doubtful face, a number headline against a word headline, an object against no object. Each is a different honest description of the same video, and the test tells you which one this audience wants.
Make the difference large. The help page says tests resolve faster when variants are more different. Twins stall. Change one lever, and change it all the way. Which levers make good variants has a list.
Keep the video in mind while making the cover. If the expression on the cover is a reaction the video never delivers, do not put it in the test. A variant that cannot keep its promise cannot win on watch time share, however good it looks in the feed.
There is one test we would run knowing it will probably come back flat. Suppose a channel has put a small logo badge in the corner of every cover for two years and someone on the team wants it gone. Two variants identical except for the badge break the "make the difference large" rule, and the likely result is Performed the same or Inconclusive. We would run it anyway, on a video with plenty of impressions, because "Performed the same" is the answer that settles the argument: the badge is not helping, drop it. A test that ends an internal dispute has earned its two weeks even when it teaches nothing about the audience. Our default position on badges is in logos on thumbnails.
Before a test, write one sentence for each variant beginning "Viewers who click this expect...". If the sentence for any variant describes a video you did not make, replace that variant. This kills the cover that would have posted the highest CTR, and we accept that, because the highest-CTR loser costs two weeks and teaches you nothing you can reuse. The sentence takes a minute.
On the bench, the second variant is a Tweak of the first: the finished render becomes the source, you change the headline or a scene detail, and everything else stays. A different expression comes from changing it on the finished result; a different layout from a Remix with another style. The variants come out identical except for the lever, which is what a test judged by watch time share needs.
Reading CTR alongside the result
The result state is the verdict. The CTR line in Analytics is context, and often confusing context, because the help page on impressions and click-through rate explains that a video shown widely on Home naturally has a lower CTR than one shown mostly on the channel page. During a test, impressions keep shifting between surfaces, so the blended CTR moves for reasons that have nothing to do with the cover. If the line falls mid-test, the usual causes of a CTR drop are more likely than a bad variant.
Use CTR after the test, not during it. Once a Winner is set, compare the video's CTR by traffic source over the following weeks with similar videos on the channel. That tells you whether the winning cover holds up in the wider feed, which a test run on a sample of viewers over a few days cannot promise.
The full method, from choosing a lever to logging the result, and the manual swap for videos the tool cannot test, is in our guide to A/B testing thumbnails with Test & Compare and by hand.
If it were our channel
Suppose we ran a personal finance channel and the next video was a calm twenty-minute walk through a first year of index investing, with no drama anywhere in the footage. Three covers are on the table: our face, doubtful, beside "£1,200 LATER"; the same face, calm, beside "YEAR ONE"; and a shocked face with "I WAS WRONG". We would write the expectation sentence for each. The first two describe the video. The third describes a confession the video does not contain, so it is out before the test starts, however many clicks it might have drawn. "YEAR ONE" goes up first, because it is the one we could live with as a default; "£1,200 LATER" second. Then we would leave it alone, ignore the CTR line while it runs, and log the outcome as "number against time framing, calm finance explainer" with the direction it went, in the decision log. Preferred rather than Winner would mean the next comparable video gets the same lever again before we move on to anything else.
What to do next
- Take the last test you ran, or the next one you plan, and write the "viewers who click this expect..." sentence for each variant.
- If one sentence describes a different video, that variant was never going to win on watch time share; replace it with a different honest promise.
- Upload the cover you would keep as the first option, so an Inconclusive result leaves you with the right default.
- When the state arrives, log the lever and the direction, and read the CTR by traffic source in the weeks after rather than the blended line during the test.