On this page
- What impressions click-through rate measures
- What YouTube says a normal CTR is
- Why per-niche CTR benchmark tables are not worth reading
- Where the impressions come from changes the number
- How to build your own CTR baseline
- What CTR cannot tell you
- CTR and watch time are two halves of one number
- Why CTR falls on a video that is doing well
- How to raise CTR without clickbait
- When to act on a CTR number
- Words used in this guide
- If it were our channel
- What to do next
Picture the Studio dashboard three days after an upload. The click-through rate has fallen by half since day one, and the view count is the best the channel has had all month. Most creators read that as a thumbnail going wrong. It is usually a thumbnail being shown to more people. A good click-through rate on YouTube is one that beats your own channel's baseline for the same traffic source and the same video age, and no other number will do. YouTube's own figure is that half of all channels and videos have an impressions click-through rate between 2% and 10%, and the same page says the number moves with where the impressions come from. So there is no single good CTR, and any table of per-niche benchmarks is guessing. Everything else in this guide is about building the number you can actually compare against.
What impressions click-through rate measures
Impressions click-through rate is the share of counted impressions that turned into a view: clicks divided by impressions, shown as a percentage in YouTube Studio. The two words that matter are "counted" and "impressions", and YouTube defines both narrowly.
YouTube's impressions and click-through rate FAQ counts an impression when a thumbnail is shown for more than one second with at least half of it visible. Some impressions, including those on external sites, end screens and some embeds, are not counted, so the click-through rate reflects a subset of a video's total views.
Three things follow from that definition.
An impression is not a look. A cover that scrolled past under a viewer's thumb, half visible, for a moment longer than one second, is an impression. So the denominator of your CTR includes many people who never evaluated the cover at all. That is why the design advice for the first pass (shape, brightness, a face, a colour that differs from the neighbours) matters so much: it is the only part of the cover that can work on someone who has not looked yet.
The numerator is only the counted surfaces. A video that gets a lot of its views from embeds on other sites, from end screens or from external links can have a healthy view count and a CTR that says nothing about it. CTR describes how the cover performed where YouTube showed it, not how the video did overall.
The arithmetic is simple, and worth writing out once with invented numbers. If a cover is counted as shown a thousand times and fifty of those become views, the CTR is 5%. Double the impressions with the same fifty clicks and the CTR halves to 2.5%, though nothing about the cover changed. The second half of that example is the usual reason a creator thinks their thumbnail stopped working.
What YouTube says a normal CTR is
The same help page says: "Half of all channels and videos on YouTube have an impressions click-through rate that can range between 2% and 10%." It adds that new videos or channels (for example less than a week old) or videos with fewer than 100 views can see a wider range, and that a video that gets a lot of impressions, for example on the Home page, will naturally have a lower CTR, while videos whose impressions come mostly from the channel page may have a higher rate.
Read that carefully, because it is usually misquoted as "the average CTR is 2 to 10 percent" or "a good CTR is above 10 percent". It says neither. It describes the range in which the middle half sits; by definition the other half sits outside it. It does not say a video at the low end of that band is doing worse than one at the high end. And it names the reason the number moves: where the impressions come from.
That second point is the key to the whole subject. YouTube is saying that CTR is partly a property of distribution rather than a property of the cover. A cover shown to the Home feed's wide audience is being shown to many people with no prior interest in the channel, and a lower rate is the natural result. A cover shown on the channel page is being shown to someone who has already chosen to look at your channel.
Why per-niche CTR benchmark tables are not worth reading
Search for "average CTR by niche" and you will find tables giving finance one number, gaming another, education a third, usually to one decimal place. None of them cites a source you can check, and the ones that name a source point to a tool vendor's aggregate of its own users, whose channels, sizes and traffic mixes are unknown.
Our view is that these tables measure distribution patterns, not thumbnails. A niche whose videos are found mainly through search will show a higher aggregate CTR than a niche pushed through the Home feed, because search impressions come from people who typed a related query. We would ignore the tables completely, even on a brand-new channel with no history of its own to compare against, and accept flying blind for the first ten uploads rather than steer by a number that describes someone else's traffic mix. Comparing your CTR to the niche figure tells you where your niche's impressions tend to come from, which you already knew, and nothing about whether your cover is doing its job.
The better question is not "what is a good CTR for my niche" but "where do this channel's impressions come from, and how does this video compare with my other videos at the same age and from the same source". That question has an answer you can compute yourself.
Where the impressions come from changes the number
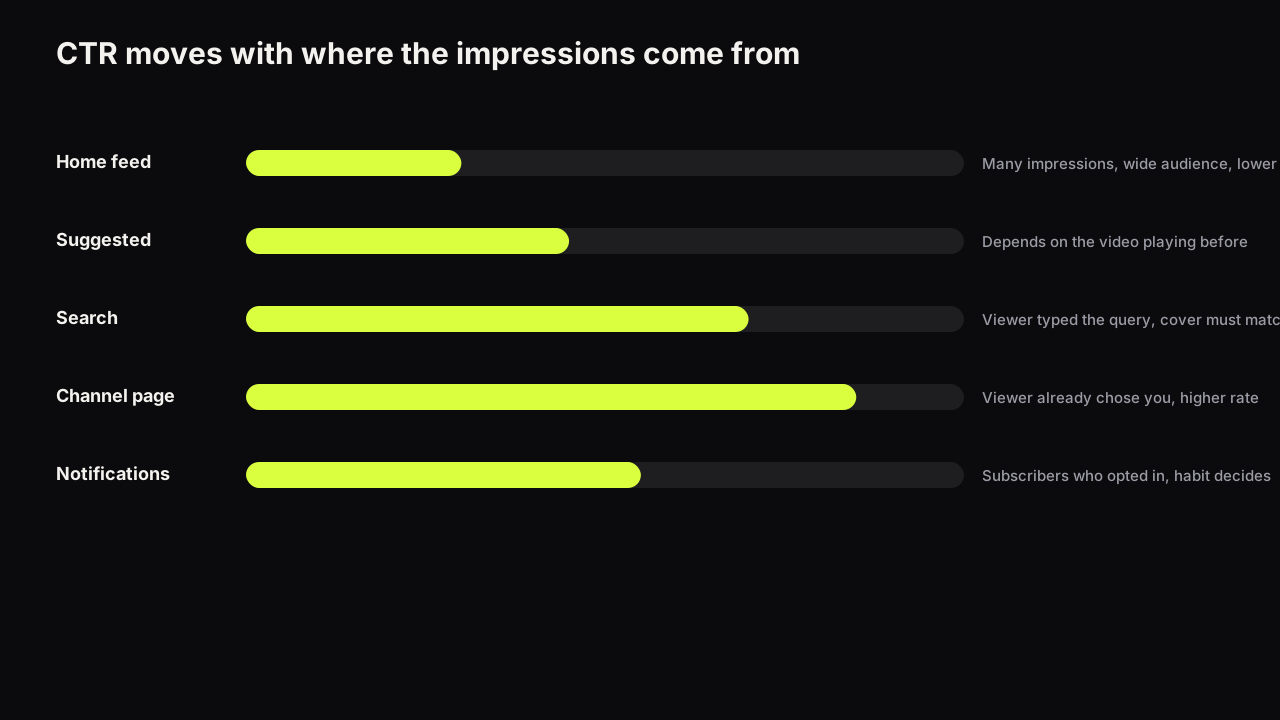
Impressions arrive from several traffic sources, and each one carries a different kind of viewer with a different reason to click. As of September 2026, YouTube Analytics reports impressions and click-through rate by traffic source, and the sources that matter most for long-form video are Browse features (the Home feed and similar surfaces), Suggested videos, YouTube search, channel pages and notifications.
| Traffic source | Who is seeing the cover | What a click competes with | Effect on CTR |
|---|---|---|---|
| Browse features (Home) | A wide audience, many with no history with you | A whole feed of alternatives | Lower, per YouTube's FAQ |
| Suggested videos | Someone watching or finishing another video | The video already playing and its other suggestions | Varies with the source video |
| YouTube search | Someone who typed a related query | Relevance to the query, other results | Often higher for exact matches |
| Channel page | Someone who chose to look at your channel | Your own other videos | Higher, per YouTube's FAQ |
| Notifications | Subscribers who opted in | Everything else on their phone | Depends on subscriber habit |
The Home and channel page rows are documented in the FAQ cited above. The rest of the table is what we observe across the channels we look at, and the pattern is consistent even though nobody has published numbers for it.
Search impressions convert well when the cover and title match the query plainly, and badly when they are clever. Suggested impressions convert according to how close the source video is to yours; a cover shown after an unrelated video gets few clicks no matter how good it is. Notification impressions convert according to how trained the audience is to open them, which is a channel habit rather than a cover property.
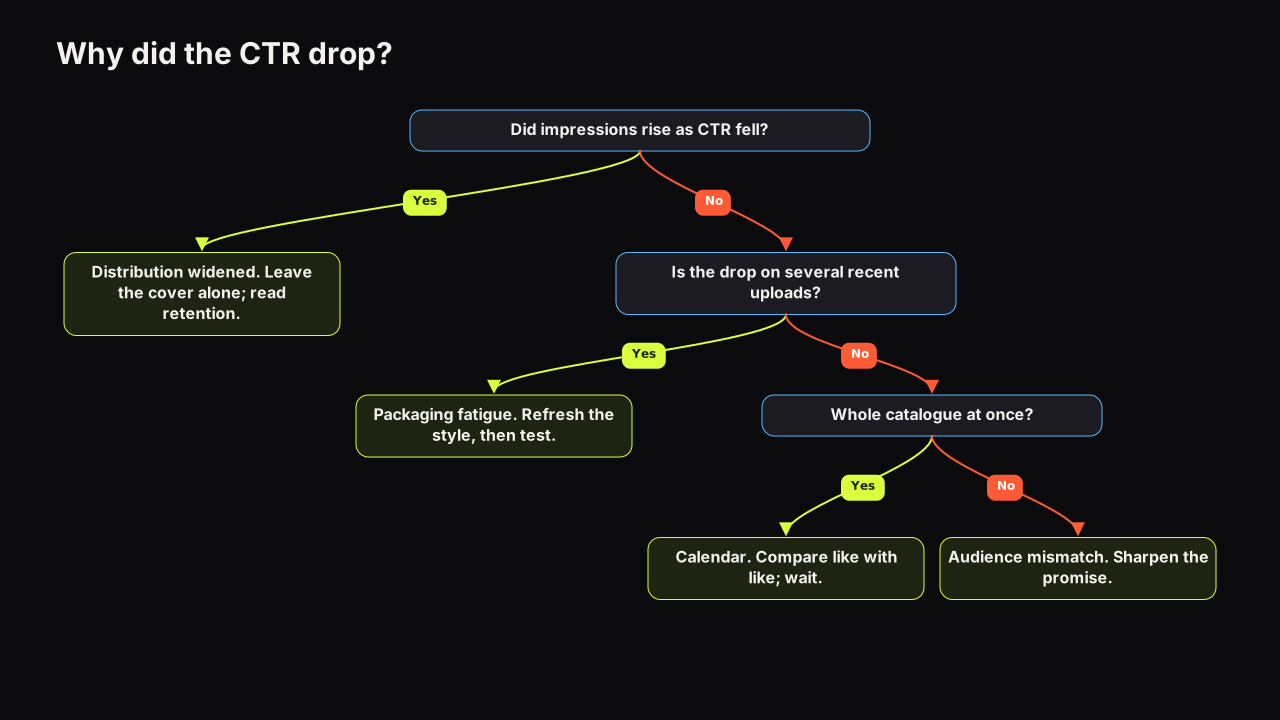
The consequence is one rule: compare like with like. A Browse-heavy video cannot be compared on CTR with a search-heavy one, even on the same channel, even with the same cover. And the same video cannot be compared with itself across time without checking whether its mix changed, because a video that breaks out of its subscriber base into the Home feed shows a falling CTR while its views rise. The reasons a CTR can fall while a video is doing well go through the four causes and how to tell them apart.
I don't have one CTR range I'd present as a benchmark, because I work across different YouTube concepts rather than judging everything from one channel, and I'm wary of universal targets anyway. A 4% CTR from Browse can mean something very different from 4% on Search or from a small, highly targeted audience. What I pay attention to is CTR relative to that channel's own normal, which traffic source it came from, how many impressions YouTube is giving the video, and whether it is expanding distribution or pulling back.
How to build your own CTR baseline
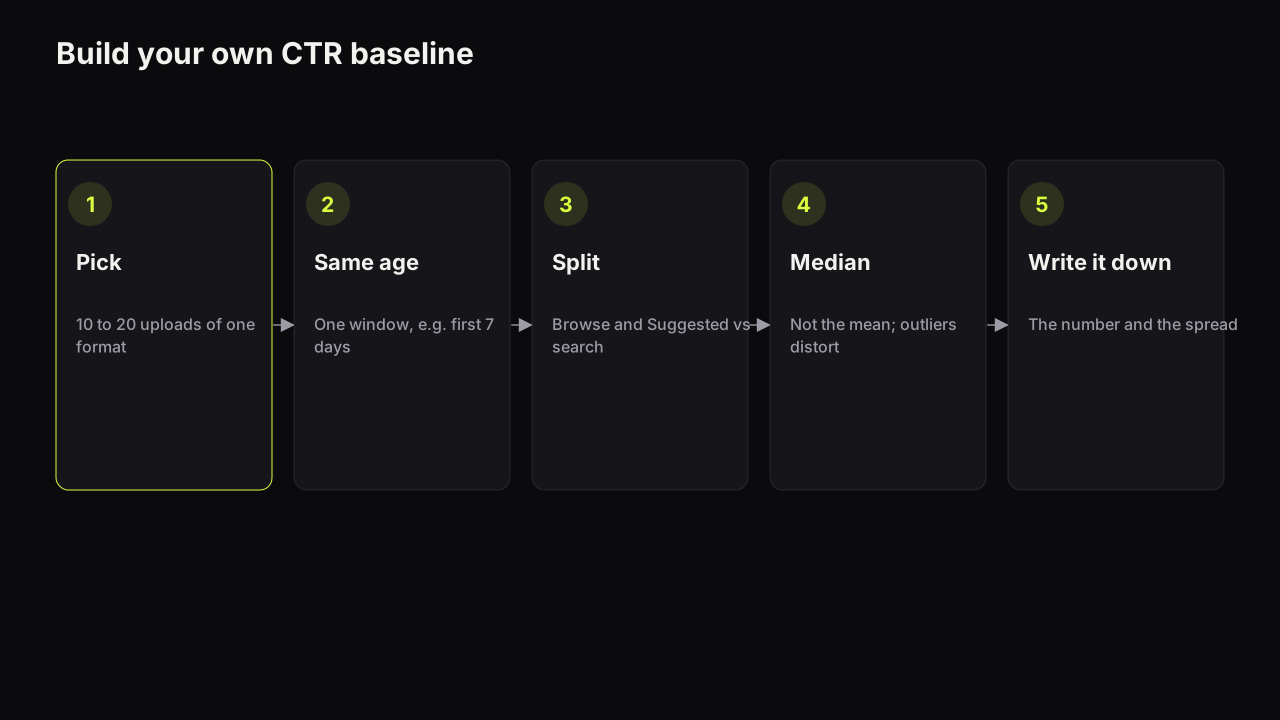
A baseline is a number you can compare a new video against, and it takes about half an hour to build the first time. The method is the same at a thousand subscribers and at a million; only the spread differs.
- Pick a set of comparable uploads. The last ten to twenty long-form videos of the same format. Do not mix Shorts, live streams or a different series into the set; each has its own mix.
- Read each video's CTR at the same age. A CTR at day one is not comparable with a CTR at day 28, because the mix of impressions shifts as a video ages. Choose one window, such as the first seven days or the first 28 days, and use the same window for every video in the set.
- Split by traffic source where you can. In YouTube Analytics, the reach reporting lets you see impressions and CTR per traffic source. Record at least the Browse and Suggested figures separately from search, because those are the sources whose share changes most from video to video.
- Take the median, not the mean. One breakout video with an unusual mix will drag an average. The median of the set is the number a typical upload achieves, which is what you want to beat.
- Write it down, with the spread. A note that reads "median for the first seven days, Browse-heavy, most uploads within a narrow band either side" tells you more than a single figure, because the band tells you what counts as a real difference and what is noise.
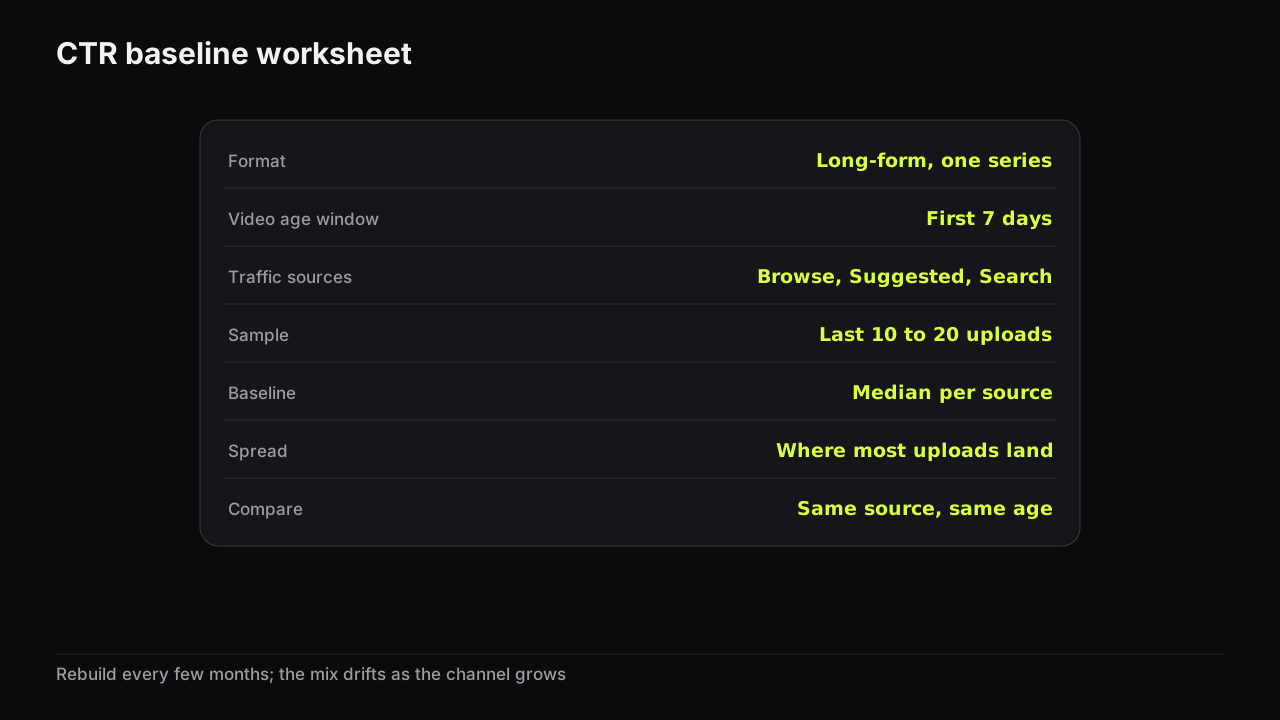
An illustrative baseline, with numbers made up for the example. A cooking channel lists its last twelve long-form uploads and reads each one's Browse CTR at day seven. The figures run from about 3% to about 7%, with one outlier at 11% from a video that went out mostly to subscribers. The median is a little under 5%; the mean would be higher, dragged up by the outlier. The note reads: "Browse, day seven, median just under 5%, most uploads between 4% and 6%." That last clause is the useful part. A new video at 4.5% is inside the band and tells you nothing. One at 3% is outside it and worth a look. Without the band, both would have looked like bad news.
Once the baseline exists, judging a new video is one comparison: its CTR at the same age, from the same source, against the median. A video below the baseline while its impressions are in the normal range is a packaging problem. A video below the baseline while its impressions have doubled is usually a distribution success, and the cover should be left alone until the retention numbers say otherwise.
We recommend rebuilding the baseline every few months rather than once, because the channel's mix drifts as it grows and as YouTube changes where it shows your videos. That costs half an hour each time and means the number you compared last month's video against is not quite the number you compare this month's against, which feels untidy. We would take the untidiness. A baseline built when most impressions came from subscribers will be flatly wrong for a channel that now lives in the Home feed, and a wrong baseline is worse than none because it looks authoritative.
What CTR cannot tell you
CTR is one half of one decision, and it is silent about the rest.
It cannot tell you how many people watched. Views are roughly impressions multiplied by CTR, plus the uncounted views from external surfaces. A high CTR on few impressions is a small video; a lower CTR on a great many is a large one. Creators who chase CTR alone end up making covers that appeal only to their existing audience, which pushes the number up and the reach down.
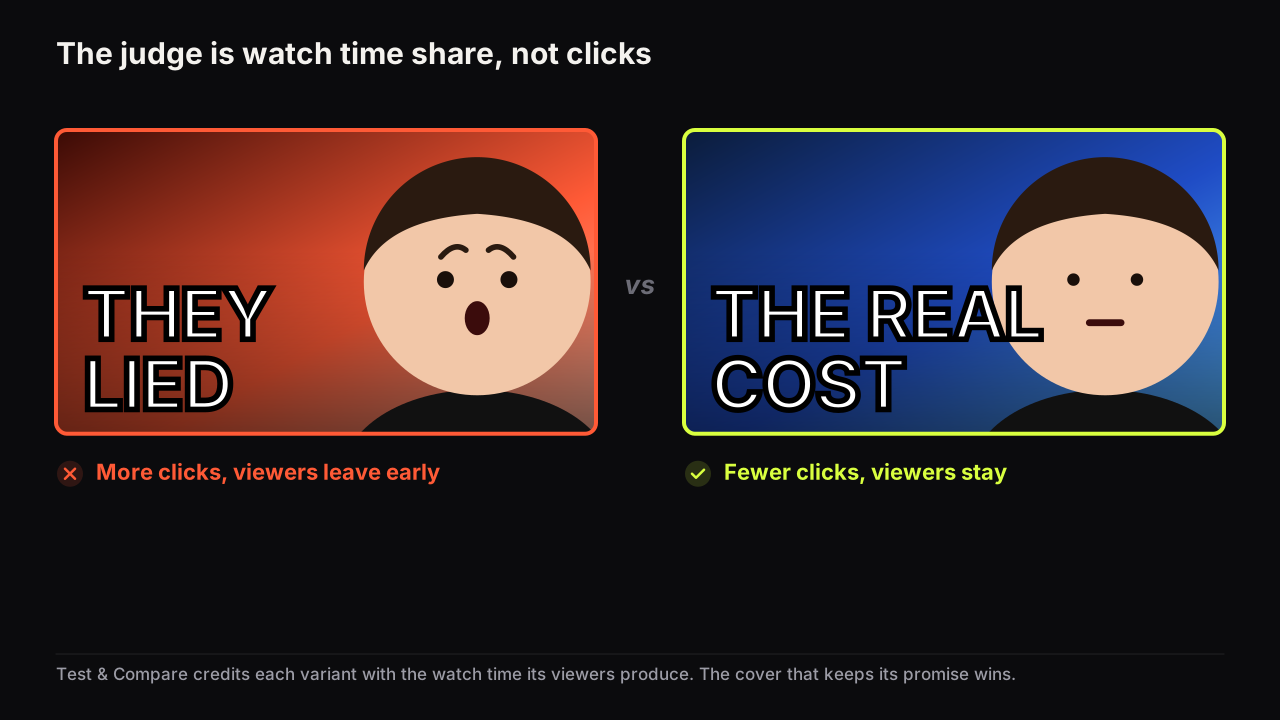
It cannot tell you whether the video was good. A click is a promise accepted; only the watch tells you whether it was kept. A cover can be excellent at earning clicks and disastrous for the channel if the video does not deliver, which is the reason YouTube's own testing tool ignores clicks when it picks a winner (more on this below).
It cannot be compared across videos with different mixes. This is the mistake behind most "my CTR is bad" conclusions.
It has no ceiling number that means "done". A rising CTR with rising impressions is the good case and it is rare. A rising CTR with falling impressions can mean distribution has narrowed to the people who already like you. The two numbers have to be read together.
It does not count everything. Embeds, end screens and external links generate views that never appear in the impression count. Imagine a video made for a newsletter's readers: most of its views arrive from the email link, none of those are counted impressions, and its Studio CTR is computed only on the handful of feed impressions YouTube happened to serve. It can look like the weakest cover on the channel while being the video that did exactly its job. Reading that CTR at all is the mistake.
We would not set a CTR target for a channel, ours or anyone's, even though a target is the thing most creators ask for first and a number on the wall is motivating. A target invites the cheapest way to hit it, which is a cover that only your subscribers understand, and the reach shrinks while the number climbs. What we would set is a habit: every new video compared against the baseline at the same age and source, and the pair of CTR and retention read together before anyone touches the cover.
CTR and watch time are two halves of one number
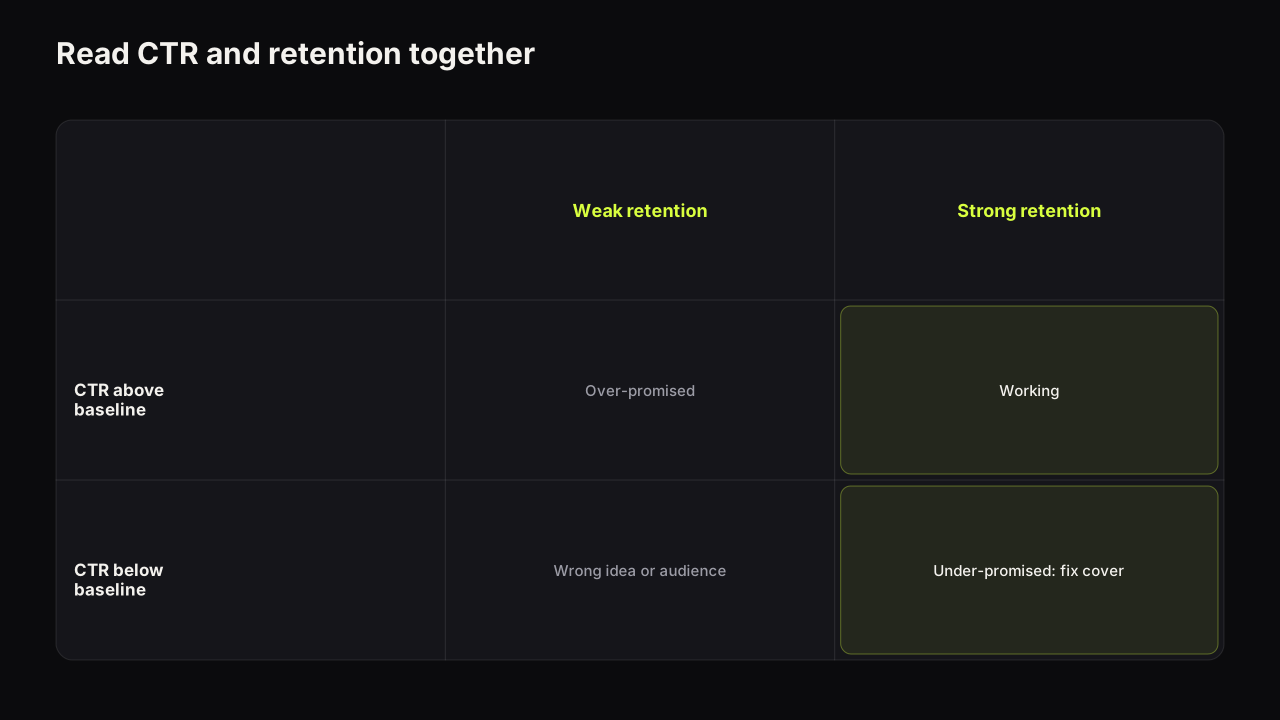
The click and the watch have to be read together, because each one changes what the other means.
YouTube's help page on A/B testing titles and thumbnails says the result of a Test & Compare test is decided by watch time share, not clicks: a Winner is the option that "clearly outperformed the others based on watch time share" to a statistically significant degree.
That design choice tells you how YouTube itself weighs the two halves. A cover that wins the click and loses the watch is not treated as a winner. So the four combinations of CTR and retention each mean something different and call for a different fix.
| Weak retention | Strong retention | |
|---|---|---|
| CTR above baseline | Over-promised: the cover writes a cheque the video does not cash. Fix the video's opening, or tone the promise down. | Working: leave it alone and write down what the cover did. |
| CTR below baseline | Wrong idea or wrong audience: the impressions are going to people who do not want this video. Check the traffic mix before touching the cover. | Under-promised: the best problem to have. The video keeps a promise the cover is not making. Change the cover. |
The bottom-right cell is where thumbnail work pays best, because the video is already doing its half. The top-left cell is where a better thumbnail makes things worse, because it sends more people to a video that lets them down, and where a test judged by watch time share will pick the plainer cover. Why the tool can pick the thumbnail with fewer clicks walks through a worked example of watch time share and what each result state means.
The honest way to raise CTR in the bottom-right cell is to open a question the video already answers: a missing outcome, a contradiction, an unusual specific. That is the information gap, and the reason it is not clickbait is that the video closes it.
Why CTR falls on a video that is doing well
The most common CTR alarm is a false one: a strong first day, then a slide while the view count keeps climbing. The FAQ quoted above gives the explanation: impressions from the Home feed naturally come with a lower rate. When a video moves from subscribers and notifications into Browse and Suggested, the denominator fills with people who had no prior interest, and the rate falls even as the video reaches more of them.
The first week is the noisiest period for this reason, and reading a CTR before the mix has settled leads to swaps that were never needed. How long a thumbnail test should run covers the waiting rules, and they apply just as much to reading a single video's CTR as to a formal test.
There is one case where we would break the waiting rule. A topical video, a reaction to something that happened this week, has most of its lifetime views in its first few days, and waiting a week for the mix to settle means deciding after the audience has gone. For that video we would read the CTR and the traffic mix at 24 hours, and if impressions are normal for the channel and the CTR is clearly under the band, swap then. The reading is noisier than we would like; the alternative is a clean reading of a video nobody is watching any more. An evergreen tutorial gets the opposite treatment: nothing touched for at least a week, because it will still be earning impressions in a year.
A different pattern deserves a different response. If CTR declines across many new uploads while the traffic mix stays the same, the covers may have stopped working as a set: the audience has habituated to a layout, or the niche has converged on the same look. That is thumbnail fatigue, and its fix is a refresh that keeps recognisability rather than a swap on one video.
How to raise CTR without clickbait
Everything that raises CTR honestly does one of two things: it makes the cover easier to evaluate at feed size, or it makes the promise more worth accepting.
Make it readable first. A cover that cannot be read at thumb width has a ceiling no psychology can lift. The face big enough to name the emotion, three words or fewer, brightness contrast that survives a dim screen: these are the fundamentals, and the full guide to how covers earn the click goes through each with its reasoning. The fastest check is to judge the cover at feed size on a phone, never on the monitor.
Then make the promise sharper. The levers behind a click, curiosity, emotion, stakes, specificity, novelty, clarity and fit with what the audience already clicks, are laid out in the psychology of why people click. Most CTR gains on established channels come from stakes and specificity: a number instead of a category, a place instead of "abroad", a verdict instead of "review".
Treat title and cover as one promise. The title says what the video is; the cover says why it matters. When both say the same thing the second look is wasted, and when they say unrelated things the viewer cannot form a question. Title and thumbnail as one promise covers the division of labour and the failure modes.
Keep the promise. YouTube's spam, deceptive practices and scams policy covers thumbnails and titles that promise content the video does not contain. Beyond policy, the watch-time-share rule above means an overpromising cover loses the test even when it wins the click.
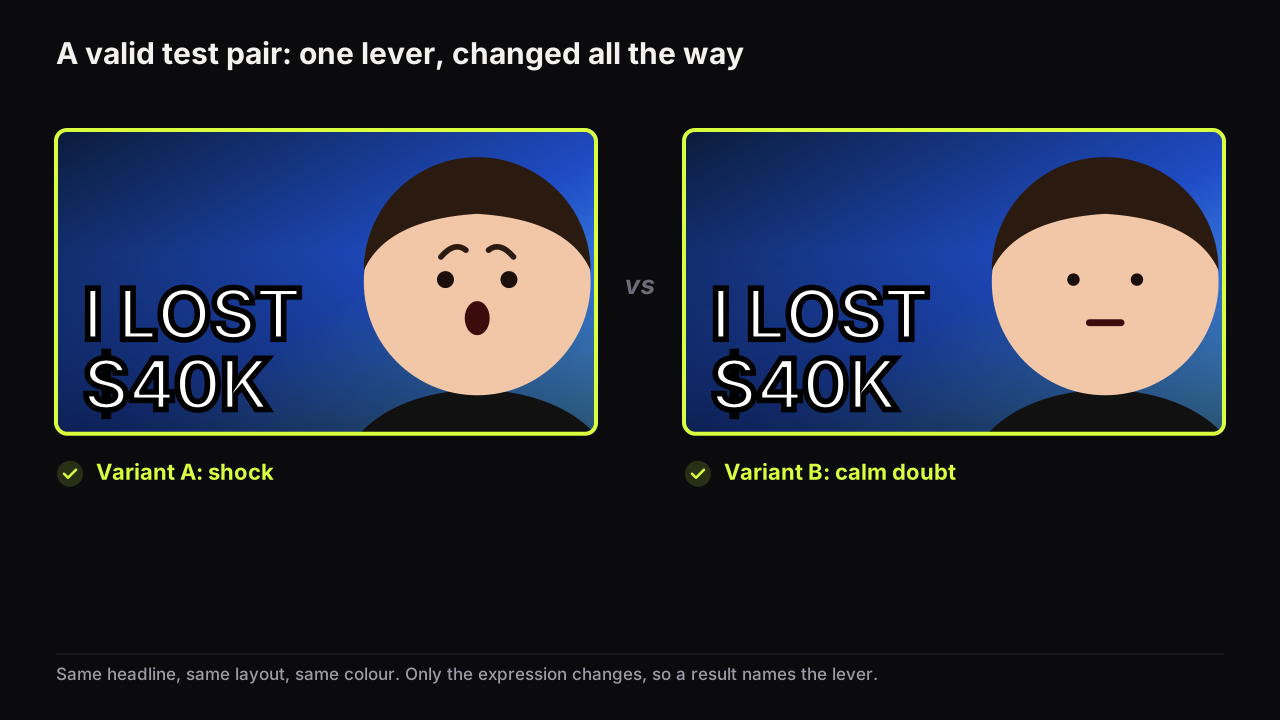
Test instead of guessing. Two candidate covers that differ in one thing, run through Test & Compare or a manual swap, teach you which lever your audience pulls. How to A/B test YouTube thumbnails covers both methods and how to design variants different enough to resolve. On the bench, Tweak uses a finished render as the source for the next one, so you can change the expression, the headline or the colour and keep everything else identical, which is what a one-variable test needs.
Before any of this, run the cover through the pre-upload checklist. A cover that fails a Read check is not a CTR problem yet; it is a legibility problem, and it is cheaper to fix.
When to act on a CTR number
A decision rule keeps you from reacting to noise. These are our recommendations, not YouTube guidance.
- Below baseline at the same age and source, with impressions in the normal range, after enough impressions to mean something: test a second cover, or swap if the video cannot be tested.
- Below baseline while impressions have jumped: leave the cover alone and read retention instead. This is distribution, not design.
- Above baseline with weak retention: fix the promise or the video's opening before the next upload, and do not copy that cover's approach.
- Fewer than a few days old, or still gathering its first impressions: wait. The FAQ says the range is wider for new videos, and the mix has not settled. The exception is a topical video, as above.
- Same cover, same mix, CTR sliding across many uploads: treat it as fatigue and refresh the style, not one video.
We would follow this list even when it says wait and every instinct says act, because the cost of a wrong swap is not just the lost cover. It is that the video's later numbers can no longer be read against its earlier ones, and the lesson is gone with them.
For a video that is already live, the question of whether a swap is worth it depends on its age, its impression volume and whether it is evergreen or topical. The decision tree for changing a thumbnail works through those in order.
Words used in this guide
Impression is one counted showing of a cover: more than one second on screen with at least half of it visible, on a surface YouTube counts. Impressions click-through rate (CTR) is clicks divided by counted impressions. Traffic source is where an impression came from: Browse features, Suggested videos, YouTube search, channel pages, notifications and others. Baseline is the median CTR of your own comparable uploads at the same age, split by source. Watch time share is each test variant's fraction of the test's total watch time, and it is how Test & Compare picks a winner. Retention is how much of a video viewers watch; used loosely here for average view duration and audience retention together. Packaging is the title and cover as one promise; creator jargon rather than a YouTube term.
If it were our channel
Suppose we ran a personal-finance channel with a written baseline (Browse, day seven, a median and a band) and a video went out on Monday about a savings account with a catch in the small print. By Thursday the Browse CTR is under the band and the editor asks whether to swap the cover. This is what we would do, as a plan rather than a story.
First, the mix. Read impressions by source for the video's first three days. If Browse impressions are two or three times what the last ten videos had at the same age, no swap. The cover is being shown to people who have never heard of us, the rate is doing what YouTube's FAQ says it will, and the view count is the number to look at. We would leave it and check retention instead.
If instead the impressions are ordinary for the channel and the CTR is still under the band, the video lands in the bottom row of the quadrant table, and retention decides which cell. Strong retention: under-promised, the best problem, and we would make the second cover that day. The current cover presumably says "savings account" in some form; the sharper promise is the catch itself, so the second cover goes to stakes and specificity, a doubtful face and the small-print figure as the headline, and we would enter both into Test & Compare and leave the title alone. Weak retention: wrong audience or wrong idea, and a better cover would only send more people to a video that loses them. Then the fix is the video's first minute or the choice of topic, and the cover waits.
Whichever branch, the note in the log is about the branch, not the number.
What to do next
Build the baseline this week: ten to twenty comparable uploads, one age window, the Browse and search figures separated, the median written down with its spread. Then take your most recent video and place it in the quadrant table above using its CTR against that baseline and its retention against your usual. If it lands bottom-right, make the second cover and test it. If it lands top-left, the next thing to fix is not the thumbnail. And if your CTR has been falling while views rise, read the diagnosis piece on why CTR drops before you change anything.
One special case deserves its own diagnosis: a video that collects impressions but almost no views.
To put the baseline method to work: the CTR baseline worksheet, what each traffic source does to the number, the calendar effect, and why channel-page and playlist impressions behave differently.
The words in this guide, and the rest of the library's vocabulary, are defined in the thumbnail glossary.