On this page
Thumbnail heatmaps and AI scores work as a sanity check on where a cover's focal point is, and they do not work as a measure of attention, clicks or click-through rate. A heatmap is the output of a saliency model, a prediction of where eyes might land on an image, made without your audience, your title, the covers beside yours or the video. A score is a number derived from the same kind of generic prediction. The only thing that measures whether a cover earns a click it can keep is showing it to real viewers, which is what Test & Compare in YouTube Studio does, and it judges by watch time share rather than clicks. Use the preview for what it can see; use a test for everything else.
What a thumbnail heatmap is
A thumbnail heatmap is a picture of a model's prediction, coloured so that the regions the model expects to attract attention look hot. The model behind it is a saliency model.
As general background: a saliency model is a piece of software trained on collections of images for which researchers recorded where people looked, usually with eye-tracking equipment and usually on general photographs rather than YouTube feeds. From those examples it learns which visual properties tend to draw the eye (faces, high local contrast, text, strong edges, the centre of the frame) and applies that learning to any new image you give it. The output is a prediction about a generic viewer looking at your image on its own, for no particular reason.
That last clause is the whole limit. No viewer on YouTube looks at your cover on its own for no particular reason. They see it in a row beside six to twelve others, under or beside a title, on a surface that came with a reason (a search query, the video they just watched, a habit of opening the app), on a phone they may be scrolling past. The model has none of that. It is not eye tracking, because no eyes were involved when it ran; it is a memory of other people's eyes on other people's pictures.
It is not CTR either, and the gap is wider than it looks.
YouTube's impressions and click-through rate FAQ counts an impression when a thumbnail is shown for more than one second with at least half of it visible, says half of all channels and videos have a rate between 2% and 10%, and says a video that gets a lot of impressions, for example on the Home page, will naturally have a lower rate than one whose impressions come mostly from the channel page.
So the rate a cover earns depends on which surface showed it, how many of the impressions were half-visible scrolls, and what the viewer was doing when it appeared. What impressions click-through rate measures is a property of the cover, the title, the surface and the audience together. A model that sees one of the four is not predicting it; at best it is describing the cover.
What an AI score is
An AI thumbnail score is a single number a tool assigns to a cover, usually presented as a rating of quality or a prediction of clicks. What sits behind the number varies by tool and is rarely published in a form anyone can check. We could not find a methodology or validation for any of the accuracy figures that circulate, and the most quoted one, that heatmap tools predict CTR with 85% accuracy, is a vendor claim with nothing behind it that we could trace; it sits with the rest of the unsourced numbers in our fact-check of thumbnail statistics.
Set the vendors aside and reason from what a click is. A click is a decision made by a person with a reason, choosing between this cover and its neighbours, with the title in view. Even a model that had learned everything about images would be predicting from a fraction of the inputs. And a model trained on which images got attention in general learns the general case: big faces, big text, high contrast, warm colours. Those are also the properties every cover in a crowded niche already has, which is what thumbnail fatigue looks like from the inside. A score that rewards the uniform cannot tell you when the uniform has stopped working.
We would run a saliency preview on a cover once and never write a tool's score into the decision log, even though the score is the more convenient number to compare across covers, because a log full of scores trains you to make the covers the model likes, and the model likes the niche's uniform.
Our view is that a score is most dangerous when it is used to choose between two of your own candidates that make different promises. It will pick the louder one, because loud is what generic attention data rewards, and the louder promise is the one that loses tests decided by watch time share when the video cannot keep it.
What a preview is useful for
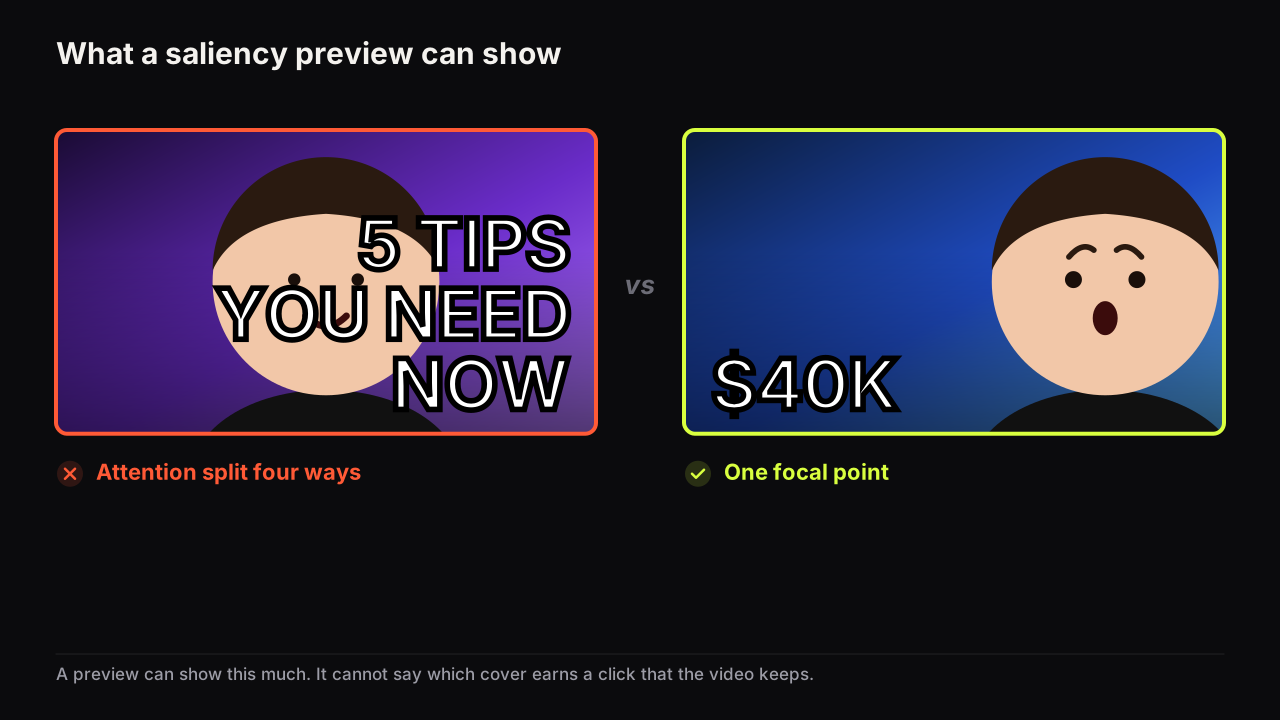
A heatmap, or any feed-size preview, is a check on the first pass of the click: the moment before reading, when shape, brightness, a face and a colour that differs from the neighbours decide whether the cover is looked at. It cannot tell you whether the cover will be chosen. It can tell you whether the cover has a focal point, and whether that focal point is the one you meant.
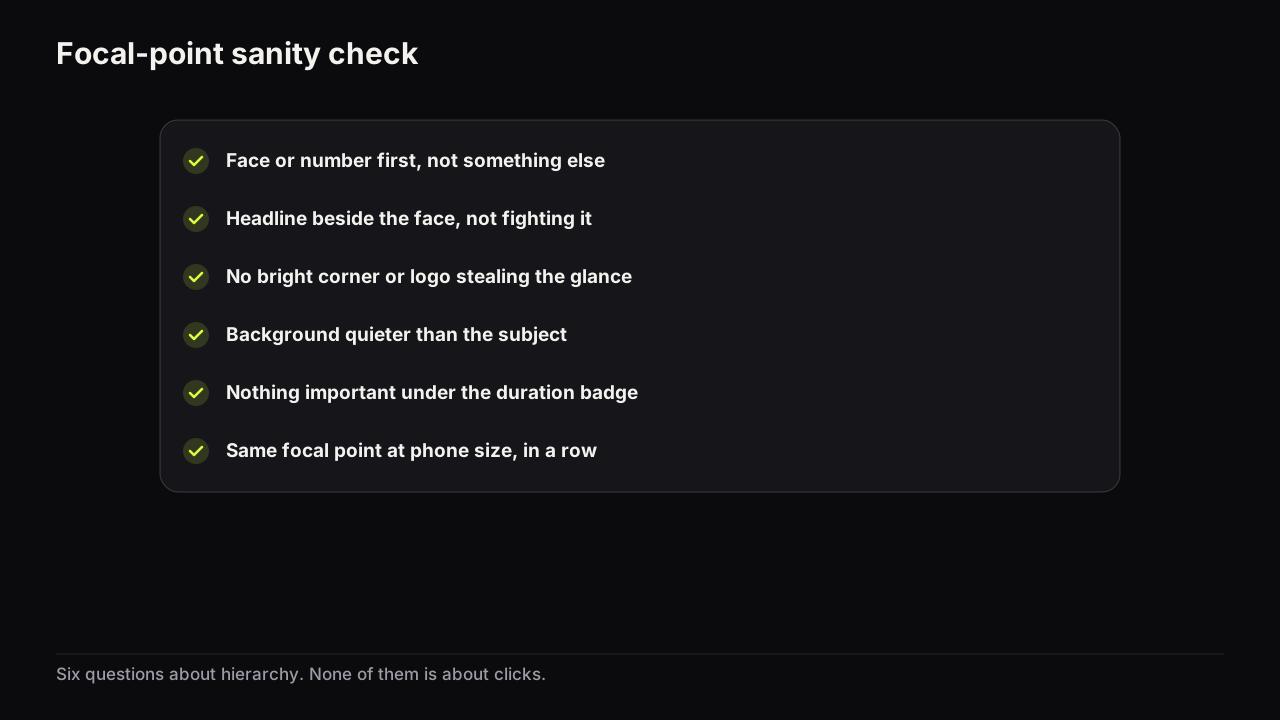
- Does attention land on the face or the number first, or on something you did not intend?
- Is the headline competing with the face rather than sitting beside it?
- Is a bright corner, a logo or a prop stealing the glance?
- Does the background pull harder than the subject?
- Is anything important sitting where the duration badge will cover it, bottom right?
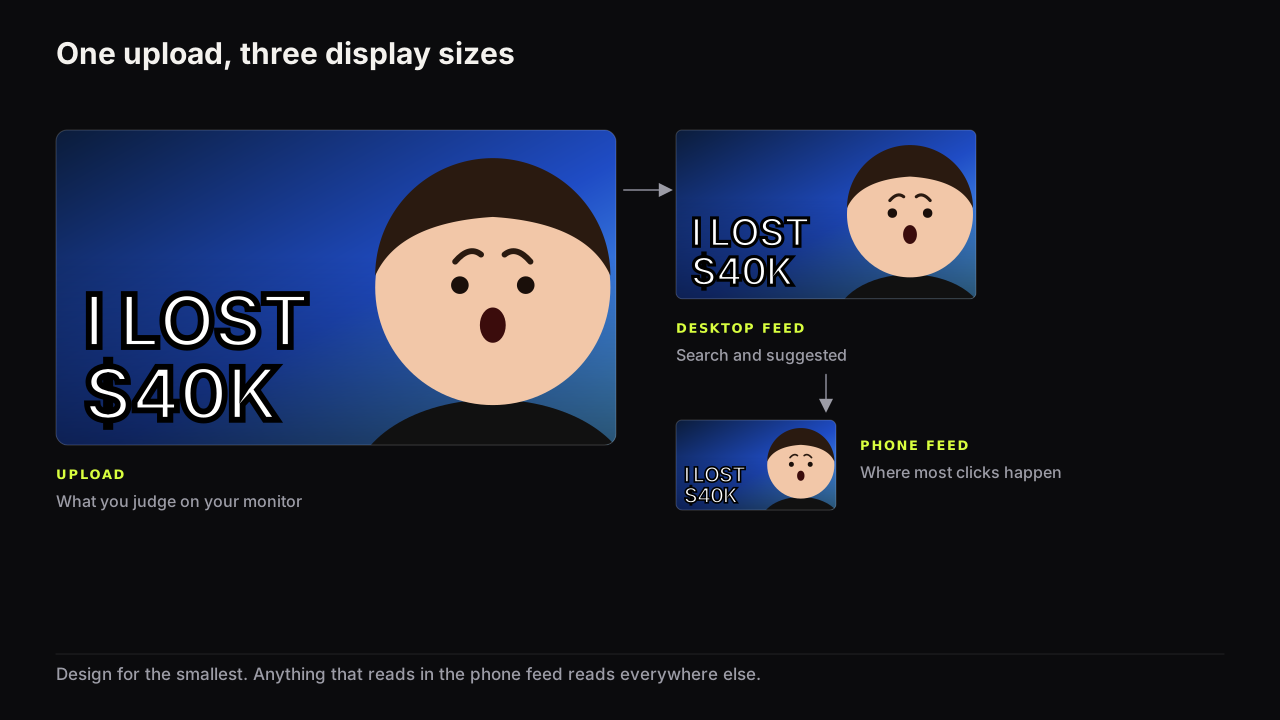
- Does the same focal point survive at phone size, in a row of neighbours?
Take a cover for a camera review: the creator's face on the right, calm, at half the height; the camera in their hands; WORTH IT? on the left in white; and in the top left corner the channel's logo, a saturated orange disc. Imagine a heatmap over it. The hot spot is the orange disc, not the face, because a bright saturated shape on a dark ground is the kind of colour and intensity contrast saliency models are built to pick out. That is a useful finding. The logo is stealing the first glance, and the fix is to dim it, shrink it or drop it. What the heatmap cannot tell you is whether WORTH IT? or a verdict face would earn more clicks, because that depends on the title beside it and the row it sits in.
Those are questions about hierarchy, and the answers are useful because hierarchy is a thing you control. The intended order, as the design principles piece lays out, is face, then headline, then object, with the background in support. If a preview says the eye goes to the background first, the cover has a fixable problem regardless of what any score says. If the preview agrees with your intended order, you have learned that the cover is not broken at the first pass, and nothing more.
Use a preview before upload, once, to catch a focal-point mistake. Then stop reading it. If two candidates both pass the six questions, the choice between them is about the promise, and no preview can make it.
The cheapest preview needs no model at all: shrink the cover to thumb width, put it in a row of covers from your niche, and look. Why the phone read decides most clicks gives the squint test and the dim-screen check, and the pre-upload checklist folds them into a routine you run on every cover.
Our free thumbnail tester does the row part of this with no account: it drops a cover into a mock search result and a phone feed so you can judge the read at the proportions viewers see. It is a visual preview only. Thumbnail Bench does not score, rate or predict click-through rate for thumbnails, and the tester gives no score and no verdict; the six questions above are yours to answer while you look at it.
What only a real test measures
A test shows the cover to real viewers on the real surface with the real title, and reads what they did next. That is the measurement every preview approximates and none replaces.
YouTube's help page on testing titles and thumbnails says Test & Compare takes up to three titles, thumbnails, or title and thumbnail combinations per video, decides the result by watch time share rather than clicks, calls a Winner only when one option "clearly outperformed the others based on watch time share" with statistical significance, and can take a few days or up to two weeks, resolving faster with more different variants and more impressions.
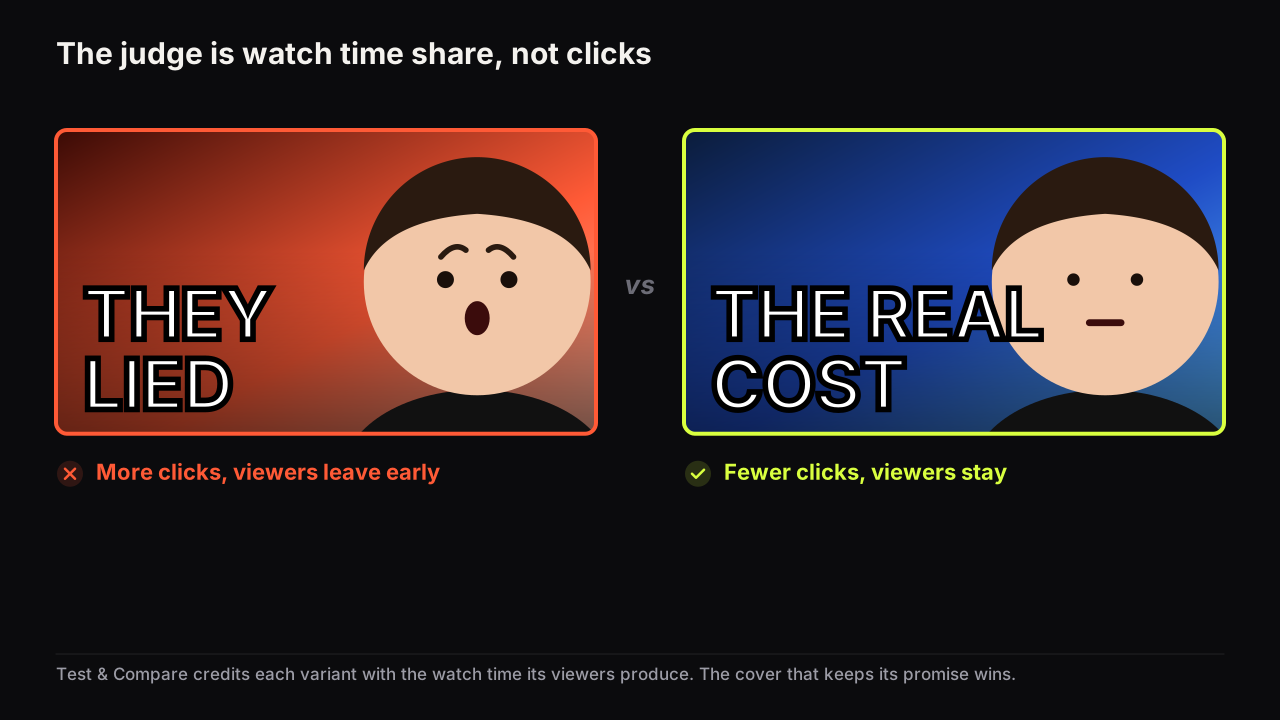
Watch time share is the part no model can reach. A cover that scores highly, draws the eye and earns the click can still lose the test, because the viewers it brought in left early; why the tool can pick the thumbnail with fewer clicks works through the arithmetic. The judge is the promise and the delivery together, and only real viewers can judge delivery.
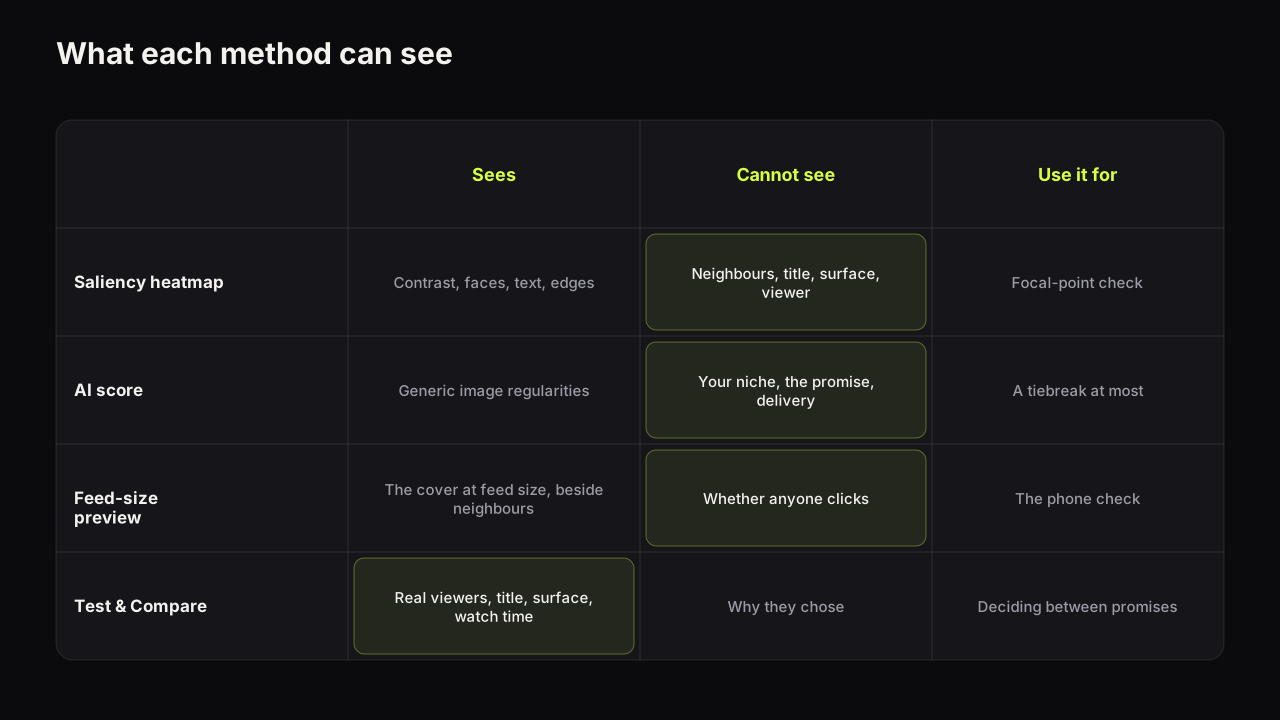
| Method | Sees | Cannot see | Use it for |
|---|---|---|---|
| Saliency heatmap | Contrast, faces, text, edges in your image | Neighbours, title, surface, viewer, video | Focal-point sanity check |
| AI score | Generic regularities of images that drew attention | Your niche's uniform, the promise, delivery | A tiebreak at most, and not between two promises |
| Feed-size preview | The cover at the size and beside the neighbours viewers see | Whether anyone clicks | The phone check before upload |
| Test & Compare | Real viewers, real surface, real title, what they watched | Why they chose (you infer that from the lever you changed) | Deciding between promises |
The method for designing a test that can resolve, the manual swap for videos the tool cannot test, and how to write down the lesson rather than the score are in the guide to A/B testing thumbnails on YouTube. A preview belongs before that process, as a filter on obvious mistakes; it does not belong inside it as a judge.
Common questions
Is a thumbnail heatmap the same as eye tracking?
No. Eye tracking records where real people looked at an image. A thumbnail heatmap is the output of a saliency model, a prediction of where attention might go, made from the image alone with no viewers involved. It can be a useful sanity check; it is not a measurement.
Can an AI tool predict my thumbnail's CTR?
Not in any way you can verify. A click depends on the title, the surrounding covers, the surface the impression came from and the viewer's history, none of which a model that sees only the image can know. The circulating claim that heatmap tools predict CTR with 85% accuracy is a vendor claim with no published methodology.
Does Thumbnail Bench score thumbnails?
No. Thumbnail Bench does not score, rate or predict click-through rate for any thumbnail. Its free tester is a visual preview that places a cover inside a mock search result and a phone feed so you can judge the read at feed size; it gives no score or verdict.
What to do next
- Run your next cover through the six focal-point questions at thumb width, in a row of neighbours, before you upload it. Fix hierarchy problems there.
- If two candidates both pass, do not ask a score to choose. Decide which promise you believe the video keeps, and test the two on the next eligible video.
- Read the result state from Test & Compare, not the CTR line, and write down the lever and the direction.
- If a tool's number disagrees with a test you ran, trust the test. It had your audience in it.