On this page
"Custom thumbnails get 80% more views" has been copied across so many pages that it now cites itself. Follow the links back and each page points to the one before it. The nearest documented sentence we can find says something different: 90% of the best-performing videos have custom thumbnails. That is a description of what winners have in common. Somewhere along the way it became a promise about what a thumbnail does.
As of September 2026, only a handful of YouTube thumbnail statistics can be traced to a primary source: YouTube's own help pages on thumbnail specs, click-through rate, A/B testing, thumbnail tips and titles, plus two pieces of reporting, one on the Vevo thumbnail refresh and one on connected TV viewing. Every other number that circulates, from "faces add 20% CTR" to "viewers decide in 0.05 seconds", is one we searched for and could not find a source for. Below: the documented numbers with what each source says and how it gets misquoted, the untraceable claims with our best guess at how each arose, and a method for checking a number yourself before you act on it.
The seven documented numbers
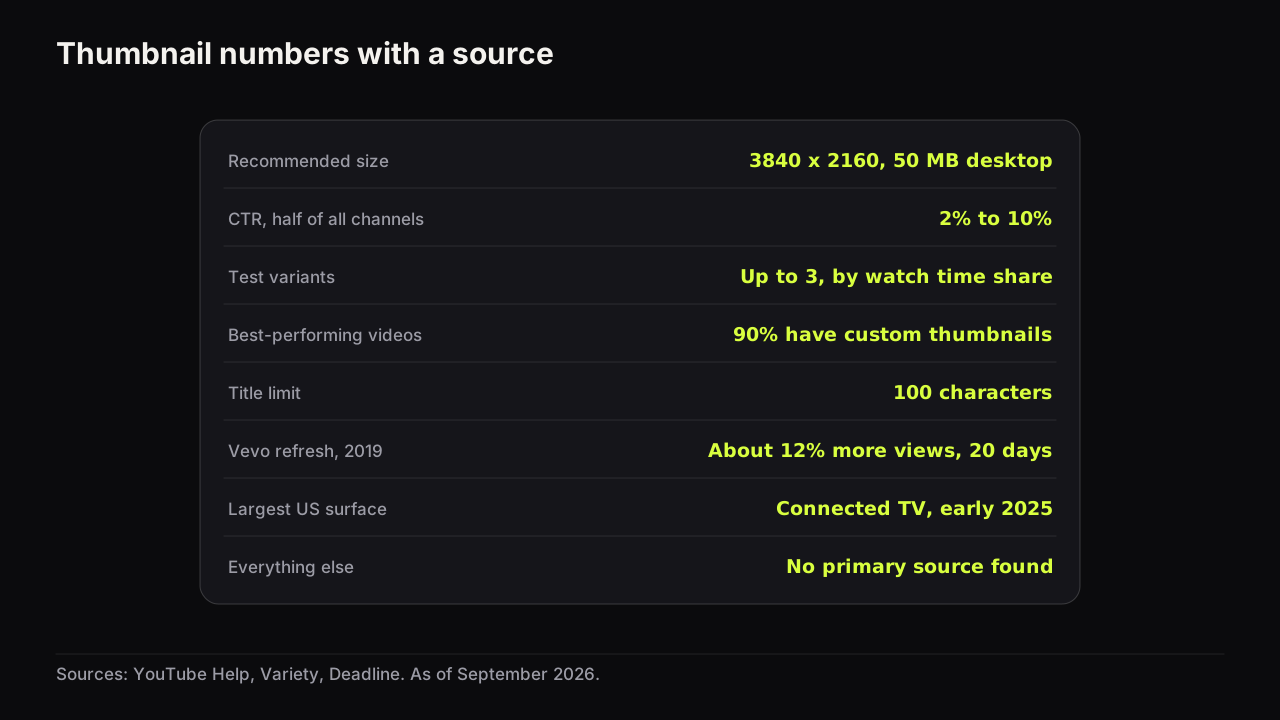
The "misquoted as" column is the version you will meet on most tool blogs. Each number's section links to its source.
| Statistic | What the source says | Misquoted as | Source |
|---|---|---|---|
| Recommended size 3840 x 2160, 50 MB from desktop | A recommendation; minimum width 640 pixels; 2 MB from mobile | "Must be 1280 x 720", "max 2 MB" | YouTube Help, custom thumbnails page |
| CTR "between 2% and 10%" | The range for half of all channels and videos; it varies with traffic source and video age | "The average CTR is 2 to 10%", "under 4% is bad" | YouTube Help, impressions and CTR FAQ |
| Up to three variants, decided by watch time share | A test takes a few days to two weeks | "YouTube picks the thumbnail with the higher CTR" | YouTube Help, A/B testing page |
| 90% of best-performing videos have custom thumbnails | A statement about the top videos, not a lift | "Custom thumbnails get 90% more views" | YouTube Help, thumbnail and title tips |
| Titles are limited to 100 characters | The field's maximum; viewers may see only part of it | "Titles get cut off at 60 characters" | YouTube Help, upload videos page |
| Vevo: about 12% more views in 20 days | 2019, music videos, about 4,000 of them, no control group | "Changing a thumbnail increases views by 12%" | Variety, 2019 |
| Connected TV is the largest US watch surface | Nielsen-derived, early 2025 | Left out entirely by "YouTube is mobile-first" pages | Deadline, 2025 |
The spec: 3840 x 2160, 640 minimum, 50 MB from desktop
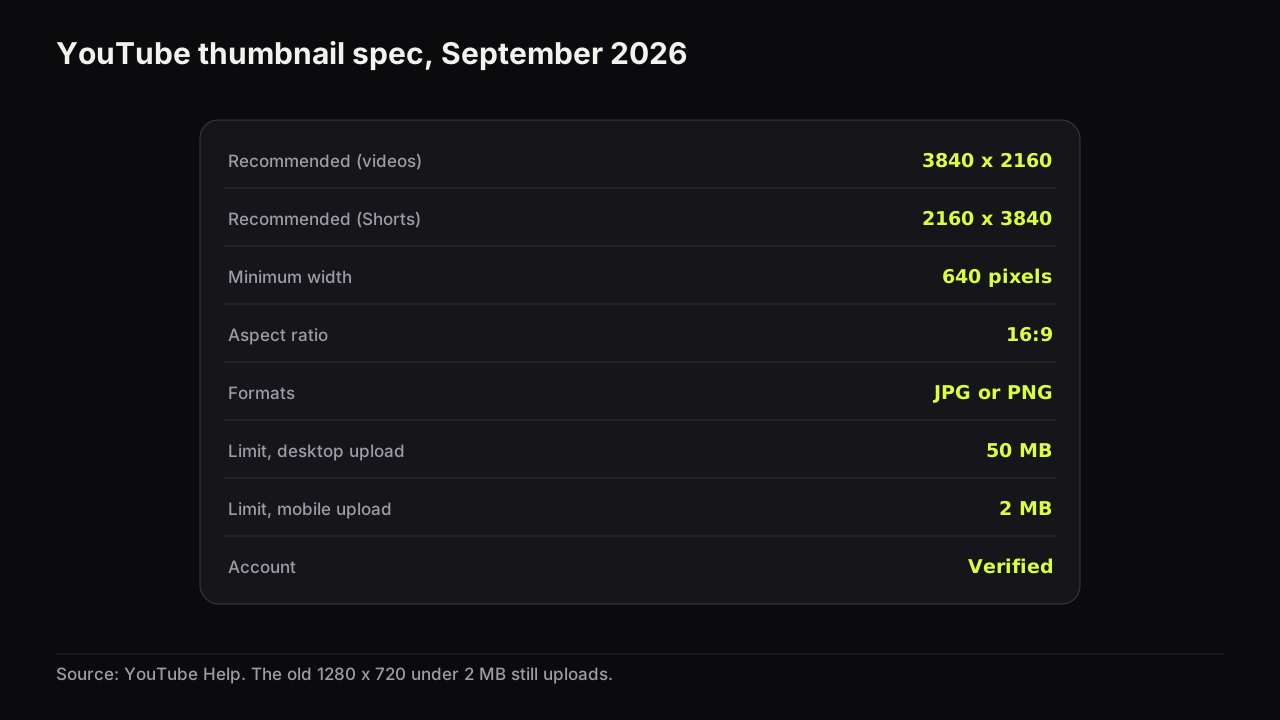
YouTube's help page on adding custom thumbnails recommends 3840 x 2160 for videos (2160 x 3840 for Shorts), sets a minimum width of 640 pixels, accepts JPG or PNG at 16:9, and limits file size by upload device: 2 MB for video thumbnails from mobile, 50 MB from desktop. Custom thumbnails require a verified account.
The misquote is the old spec presented as a rule. The 1280 x 720 recommendation and the flat 2 MB limit were replaced in late 2025, a change reported by 9to5Google. The older file still uploads, because what rejects a file is the 640-pixel minimum and the per-device cap. The full table and an export recipe are in the size and spec reference.
CTR: half of all channels and videos sit between 2% and 10%
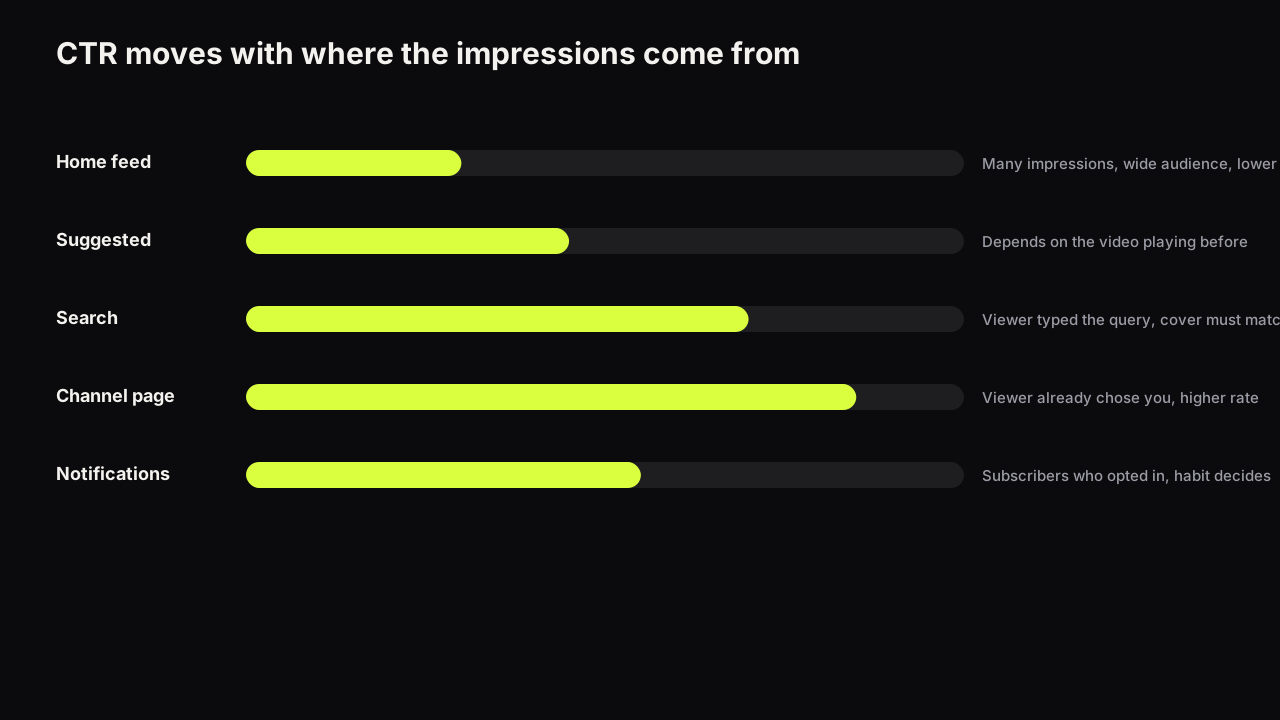
YouTube's impressions and click-through rate FAQ says: "Half of all channels and videos on YouTube have an impressions click-through rate that can range between 2% and 10%." The same page says new videos and channels, and videos with fewer than 100 views, can see a wider range; that a video shown widely (for example on the Home page) will naturally have a lower rate; and that an impression is counted when a thumbnail is shown for more than one second with at least half of it visible, with some impressions (external sites, end screens, some embeds) not counted at all.
This is the most misquoted number in the field, in three directions. It is turned into an average ("the average CTR is 5%"). It is turned into a grade ("under 4% means your thumbnail is bad"). And it is contradicted by pages quoting a platform-wide "0.65%" with no source. The sentence describes a range for the middle half of everything on YouTube. It says nothing about what a good number is for your channel, because the same page says the number moves with traffic source and video age. What impressions click-through rate actually measures, and how to build a like-for-like baseline from your own analytics, is a separate article.
Our view is that this one true range has done more damage than most of the invented numbers, because it is real and so creators grade themselves against it. A channel whose impressions mostly come from Home can sit under 2% with excellent covers; a small channel fed by its own channel page can sit above 10% with poor ones. We would rather a creator had never heard the range than treat 4% as a pass mark, and we would still quote it, because the alternative is leaving the field to the 0.65% pages.
Tests: up to three variants, decided by watch time share
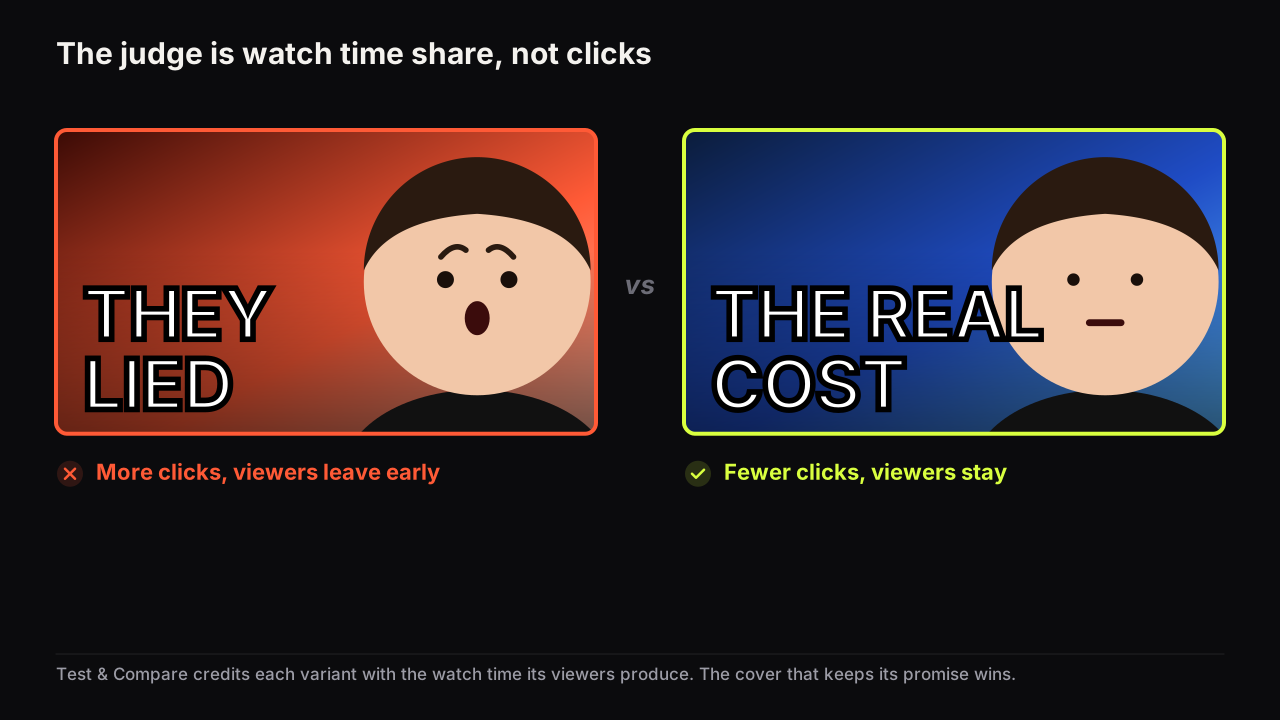
YouTube's help page on A/B testing titles and thumbnails says a test can include up to three titles, thumbnails or combinations, that the result is decided by watch time share, and that a test can take a few days or up to two weeks. Result states are Winner, Preferred (thumbnail-only tests), Performed the same, and Inconclusive, in which case the first uploaded option becomes the default.
The misquote is "YouTube shows each thumbnail to half your audience and keeps the one with more clicks". The tool does split impressions, but it judges by the share of watch time each variant earned, which is why a cover with more clicks can lose the test. Nearly every A/B testing guide gets this wrong, and it changes what a winning cover is: not the one that earns the most clicks, the one that earns clicks the video keeps.
90% of the best-performing videos have custom thumbnails
YouTube's thumbnail and title tips page says: "90% of the best-performing videos on YouTube have custom thumbnails."
This sentence is the origin of most "custom thumbnails get X% more views" claims, and it does not say that. Among the top videos, nine in ten use a custom thumbnail. It says nothing about what share of all videos do, and it measures nothing about what happens when a video switches from an auto-generated frame to a custom cover. The best-performing videos are also more likely to have scripts, editors and a schedule. The sentence describes what serious channels do, not what a custom thumbnail causes. It is a good reason to upload one, and the case for a custom cover over the auto-generated frame rests on that reading rather than on a lift figure.
Titles: 100 characters, and viewers may only see part of one
YouTube's upload help page sets the title field's maximum at 100 characters. The thumbnail and title tips page adds that viewers may only see part of the title, and advises limiting ALL CAPS and emoji.
Two limits get confused here: the hard limit (100 characters, documented) and the display truncation (real, undocumented as a number). A precise cut-off in characters or pixels describes one device on one day. The practical rule is that the promise lives in the first words and the cover carries what a truncated title cannot.
Vevo: about 12% more views over 20 days, with three caveats
Variety reported in 2019 that Vevo refreshed thumbnails across roughly 4,000 catalogue music videos and saw about a 12% average lift in views over the first 20 days.
It is the only public before-and-after with a number attached, which is why it is quoted everywhere, usually as "changing your thumbnail increases views by 12%". The caveats are part of the fact: 2019, music videos, no control group, so some of the lift could be anything else that happened to those videos in those 20 days. It supports one narrow claim, that a systematic refresh of a catalogue with continuing demand can move views, and when a thumbnail change is worth making rests on that narrow reading.
Connected TV is the largest US watch surface
Deadline reported, from Nielsen-derived figures, that in early 2025 connected TV became the largest US YouTube watch surface.
This one is ignored rather than misquoted. Most thumbnail advice still assumes a phone-only viewer. The same file serves both and the failure modes overlap (thin strokes, small faces, low brightness contrast), but a cover checked at thumb width should also be checked from across a room. Designing for the TV screen covers what changes and what does not.
Circulating claims we searched for and could not trace
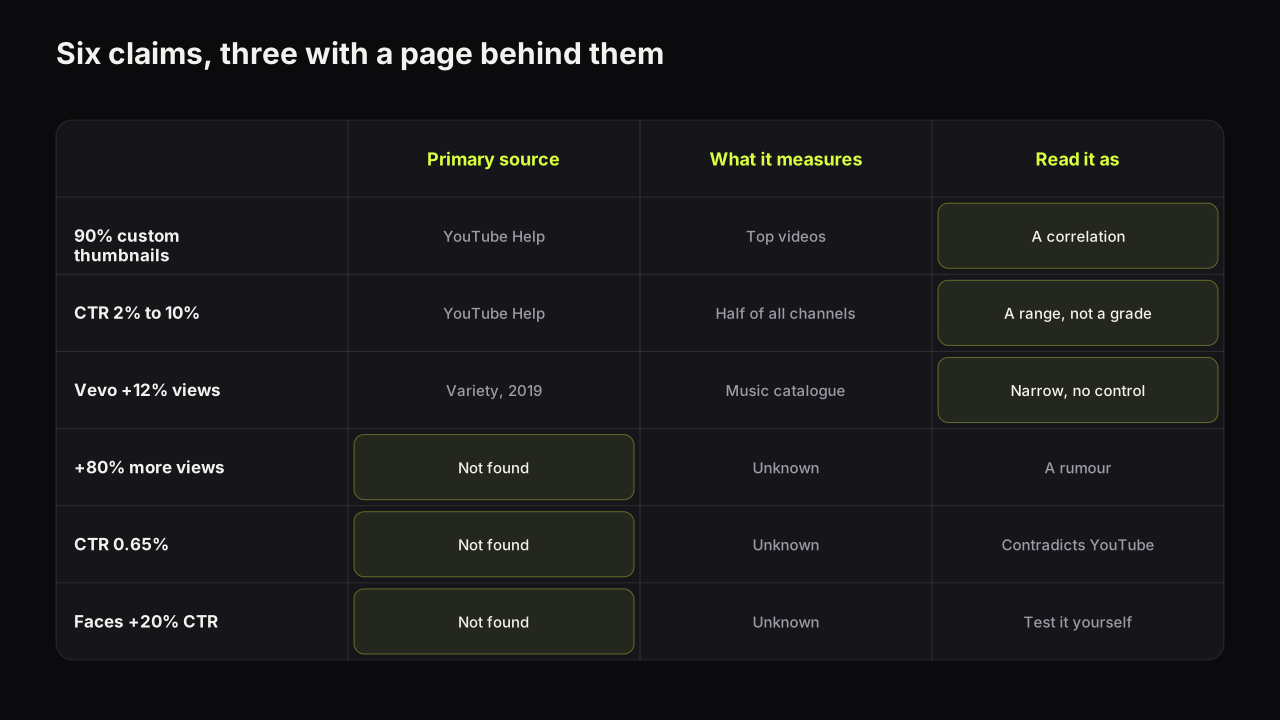
For each claim below we looked for the page, dataset or report that made the original measurement and could not find one. That does not make a claim false; a number can be true and unsourced. It means nobody can tell you who measured it, on which videos, or what it measured, so it cannot carry a decision.
| Claim | What we found | Nearest documented fact |
|---|---|---|
| "Custom thumbnails get up to 80% more views" | No YouTube source; no dataset | 90% of best-performing videos have custom thumbnails (a correlation) |
| "Most videos have a 0.65% click rate" | No source; contradicts YouTube's 2% to 10% range | The 2% to 10% range for half of all channels and videos |
| "Backlinko: custom thumbnails see 60 to 70% higher CTR" | Not found in any Backlinko publication | None |
| "Social Blade survey, December 2025: 47.3% of creators stopped using AI thumbnails" | No such survey found | None |
| "AI thumbnails lower CTR by 22%" | No source | None |
| "Faces increase CTR by 20%" / "eye contact adds X%" | No source | Tests are decided by watch time share; test it on your channel |
| "Urgency +41%, social proof +36%, exclusivity +33%" | No source | None |
| "Contrasting colours increase CTR by 30% (Vidooly, 2023)" | Study not found | None |
| "Transformation thumbnails get 4x engagement (Social Media Examiner)" | Not found | None |
| "Viewers decide in 0.05 seconds" / "you have 12 seconds" | No source | The impression definition: shown for more than one second, half visible |
| "Mobile thumbnails render at 168 x 94" / "safe zone is the centre 1100 x 620" | No documentation; rendered sizes vary by device and app version | Minimum width 640; recommended 3840 x 2160 |
| Per-niche CTR tables (Gaming 8.5%, Education 4.5% and similar) | No dataset behind any of them | YouTube publishes only the 2% to 10% range |
| "MrBeast pays $10K per thumbnail" / "CTR went from 5.2% to 18%" | Secondary blogs only | None |
| "Heatmap tools predict CTR with 85% accuracy" | Vendor claim, no methodology | Only a test on YouTube measures a cover's result |
How the lift figures probably arose
We cannot prove where "80% more views" or "60 to 70% higher CTR" came from. We can describe the path a number like that usually takes. A documented correlation (90% of top videos have custom thumbnails) gets restated as a cause ("custom thumbnails make videos perform"). Someone attaches a figure to the cause, perhaps from one channel's own before-and-after, perhaps from nowhere. A later writer, needing a citation, attributes the figure to a name that sounds like it publishes research. From then on every page cites the page above it.
The Backlinko attribution is the checkable part. We searched Backlinko's published studies for the 60 to 70% figure and did not find it. If you want to verify that yourself, the method takes five minutes: search the exact phrase in quotation marks together with the site name, then open the oldest dated result and see whether it links to a study or to another blog. When the oldest page you can find is itself citing someone else, the trail has ended and the number has no owner. The design-lift figures (faces, eye contact, urgency, contrasting colours, transformations) all fail the same test. What we can say about faces is observed rather than measured, and it is laid out in how expressions carry the promise.
How a precise-looking figure like 47.3% arises
A decimal point is doing a lot of work in "47.3% of creators stopped using AI thumbnails". Precision reads as evidence. Surveys that exist have a page: a publisher, a date, a sample size, a method. We looked for this one and found no such survey. The way to check any survey claim is the same: go to the named publisher's own site, not to the page quoting it, and search for the report by title or month. A real survey wants to be found. If the publisher has no trace of it, treat the number as unsourced until someone produces the page. The companion figure, "AI thumbnails lower CTR by 22%", and the "85% accuracy" claim for heatmap tools, share the same gap: no sample, no method, no page. A saliency heatmap predicts where eyes might land, not whether a thumb taps, and whether heatmaps and AI scores work takes that apart properly.
How the timing and pixel figures arise
"0.05 seconds", "12 seconds" and a rendered size of 168 x 94 are the easiest to explain, because each could be a true measurement of one thing generalised into a law. Someone measured a thumbnail on one phone in one app version and published the pixel count; the app changed and the number did not. Someone read a study about how fast people judge faces or web pages, never about YouTube, and the figure migrated. The only timing YouTube documents is the impression definition: shown for more than one second with at least half visible. To check the pixel claim, screenshot your own phone's feed today and measure a thumbnail, then do it on a second device. The two numbers will not match, which is the point.
We do not call any of these claims false. An empty search proves only that we could not find the source. If you know where one of these numbers was originally measured, we would like to read it and will update this page.
How to read a thumbnail statistic
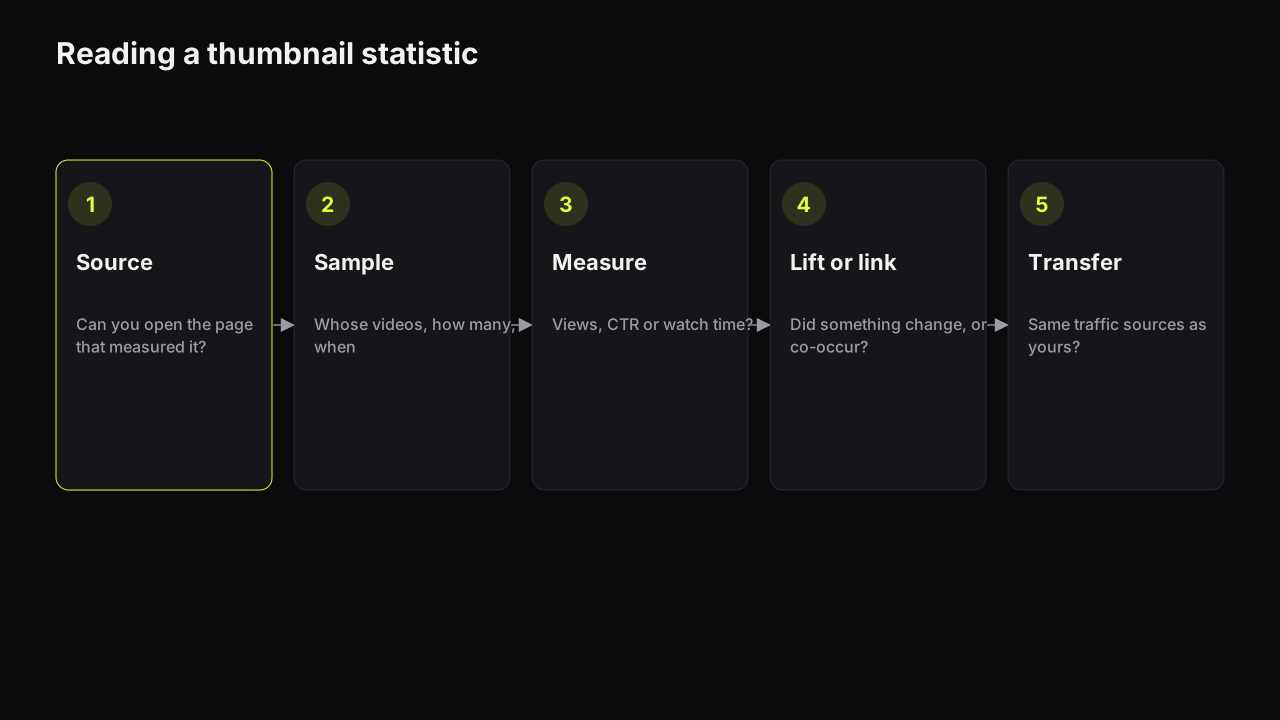
Four questions sort every number you will meet.
- Who measured it, and can you click through to them? A statistic with a name attached ("Backlinko says", "a Vidooly study") is not sourced until you can open the page that made the measurement. If the trail ends at another blog, it has ended.
- What was the sample? Whose videos, how many, over what period, in which niches. The Vevo figure is usable because Variety reported all four; the "47.3% of creators" survey is not because none of them exist.
- What does it measure? Views, impressions click-through rate and watch time are three different things, and a claim about one is often quoted as if it were about another. "90% of best-performing videos have custom thumbnails" measures the presence of a feature among top videos. It measures nothing about clicks.
- Is it a correlation or a lift? A correlation describes what successful videos have in common. A lift describes what happened when something changed, ideally against a control. Almost every thumbnail statistic is the first kind rewritten as the second.
Then the question that matters most: does it transfer to you? YouTube's CTR page says the rate depends on traffic source and video age, so a number measured on someone else's channel, or on all of YouTube, says little about what your cover should earn from your Home-feed impressions this month.
Keep one statistic for your own channel and ignore the rest: your impressions click-through rate per traffic source, on videos of the same age, compared with itself over time. We would do this even though it means giving up the comfort of knowing where we stand against everyone else, because that comfort is what the invented benchmarks sell and it has never told anyone what to change on a cover. When two covers compete for a video, let YouTube's testing tool decide by watch time share, or run a manual swap and compare like with like. The CTR baseline worksheet is the ten-minute version.
Thumbnail Bench does not score thumbnails or predict click-through rate. What the bench does is produce the candidates: type the scene, add the headline, and get up to four options to put in front of the test.
The one I believed and later doubted is the idea of a universal good CTR. I used to treat CTR as a standalone score. The deeper I got into building tools for creators, the less useful that became. Traffic source matters, audience matters, topic matters, and how many impressions YouTube is giving you matters. A thumbnail holding a lower CTR while YouTube pushes it to a much larger cold audience may be doing a better job than one with a huge CTR from a small group of loyal subscribers. Context beats the benchmark.
Why per-niche CTR benchmarks cannot exist without a dataset
A table that says gaming channels average 8.5% and education channels 4.5% needs one thing to be true: someone with the analytics of a large, representative sample of channels in each niche, over the same period, computed the averages. Only YouTube has that data, and YouTube publishes one sentence about it, the 2% to 10% range for half of all channels and videos.
Everyone else has a self-selected slice: the users of one tool, the clients of one agency, the respondents of one survey. Those slices skew towards channels of a certain size with a certain traffic mix, and the CTR FAQ says traffic source alone moves the number. A niche average that blends a Home-fed channel with a channel-page-fed one describes neither.
Per-niche tables persist because they are comforting, not because anyone believes the decimals, and we would not publish one even if a tool handed us the data to build it. A table from our own users would describe our users, and a creator reading it would grade a Home-fed channel against a channel-page-fed one and draw the wrong lesson. The cost is that this page has no benchmark to offer, which is a real gap for a reader who wants a number. Compare your CTR with your own videos from the same traffic sources; it takes ten minutes in YouTube Studio and answers the actual question.
The one use of a cross-channel number is a sanity check on order of magnitude. If a video's CTR from Browse features is a fraction of a percent while your other videos earn several percent from the same source, the packaging is wrong, and the reasons a CTR falls are the place to start.
If it were our channel
Suppose we ran a mid-sized channel and a sponsor's brief arrived quoting three of the numbers above: "faces add 20%", "you have 0.05 seconds", and a niche benchmark saying channels like ours should be at 7%.
We would run the four questions on each. All three fail the first, so none gets into the brief as a fact. We would say so politely and offer the documented alternatives: YouTube's 2% to 10% range with its caveats, and the watch time share rule for tests.
Then open YouTube Studio and build the number that does apply. Filter to videos published in the last six months, at least four weeks old so they have settled. Read CTR from Browse features and from Suggested separately, note the median of each, and write both down with the date. That is the baseline. If the sponsored video lands inside those ranges from the same sources, the cover did its job whatever the brief said it should hit.
And if the sponsor wanted the face question settled, we would not quote anyone. We would make a face-led and a no-face cover for the video, put both through Test & Compare, and report the result state YouTube gave back. One channel, one video, one honest answer, which is one more than the 20% figure has ever had.
What to do next
Bookmark the seven documented numbers and treat everything else as a rumour with a decimal point. When a page quotes a thumbnail statistic, run the four questions before repeating it. Then open YouTube Studio and build the one benchmark that applies to you, your own CTR by traffic source, with the baseline method in the CTR guide linked above. For the design rules themselves, which this library states as recommendations rather than percentages, start with the full guide to how covers earn the click.
Every term used above is defined in one or two sentences in the thumbnail glossary.